14 Charts this year that helped us better understand COVID’s impact on students, teachers and schools
Kevin Mahnken | December 21, 2022
Your donation will help us produce journalism like this. Please give today.
 The pandemic had to end sometime. Historians will ultimately place its climax at some point in 2022.
It was the year that Dr. Anthony Fauci, America’s most prominent public health authority, declared that the country was “out of the pandemic phase,” as COVID case rates plummeted from their Omicron highs. By the fall, President Biden was in somewhat controversial agreement with that sentiment, noting that most people had laid down their masks and returned to something like normal.
And while some uncertainty remains around the possibility of winter surges in American schools, the most visible hallmarks of the COVID era have at last receded. The lurching progression from in-person to virtual classes is over, following an explosion of school exposures last winter. Mask mandates, social distancing, and endless disinfectant wipes are also predominantly a thing of the past, with virtually all children approved to receive vaccines.
But in terms of the pandemic’s impact on education, it’s still only the end of the beginning. With each month, new findings emerge revealing more about what remote instruction did to learning and how families reacted. The potentially lifelong shadow the virus has cast over K-12 students — from how babies develop speech to what today’s adolescents will earn decades from now — is largely mysterious.
Previous editions of this list have covered the wider world of education policy and research: issues like school financing, choice, accountability, and testing. This year, The 74 is focusing exclusively on the lessons of the COVID era — one that is now passing from the scene — and the questions that remain in its wake.
Here, laid out in charts, maps, and tables, are 14 discoveries that changed how we think about schools in 2022.
The scope of learning loss
By the end of last year, a steady trickle of research had already begun to reveal the harm wrought by prolonged school closures and the transition to virtual instruction. But this fall brought the most definitive evidence yet of the scale of learning lost over more than two years of COVID-disrupted schooling: fresh testing data from the National Assessment of Educational Progress, sometimes called the Nation’s Report Card, pointing to severe declines in core subjects.
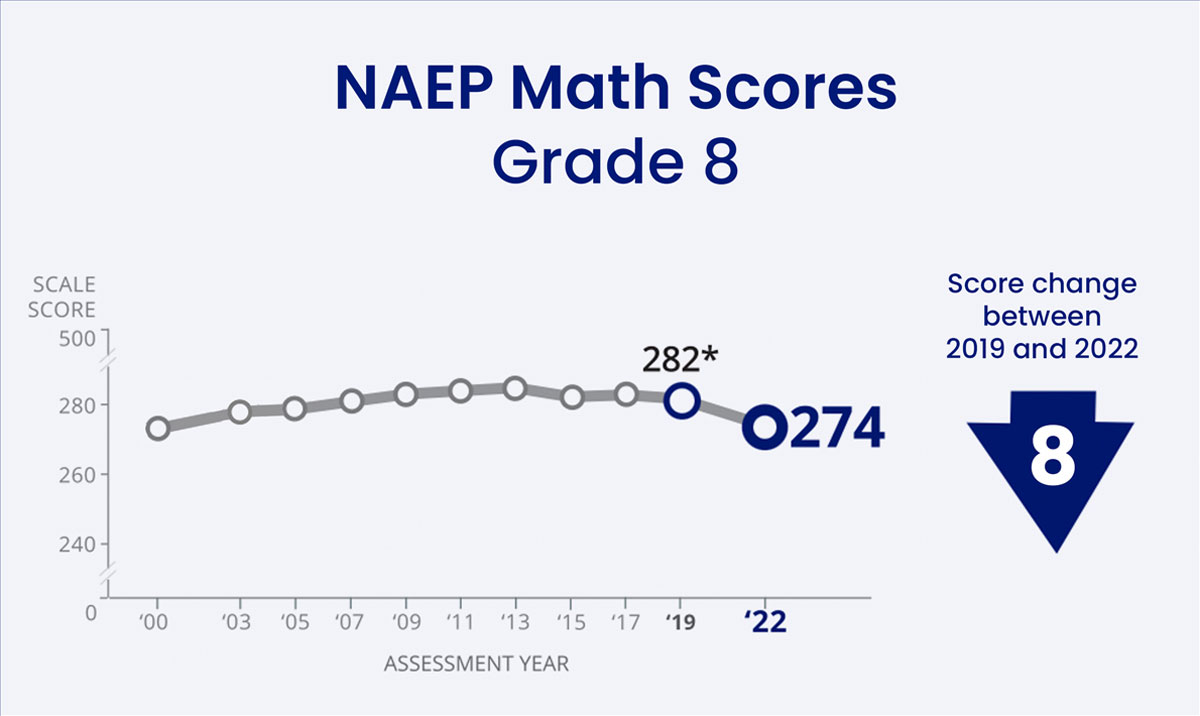
The unprecedented drop in math scores, which fell by an average of eight points for eighth graders and five points for fourth graders, was especially disturbing. But reversals in literacy were also notable, with sizable increases in the number of students testing below even the “basic” level of reading proficiency. What’s more, the results affirmed dismal findings from NAEP’s “Long-Term Trends” test — an earlier version of the exam that has been administered since the early 1970s — showing that the pandemic set back nine-year-olds’ performance in math and reading to levels last seen two decades ago.
“We’re seeing a lot of that very long-term progress completely erased over the course of a couple of years,” said Dan Goldhaber, a University of Washington professor, of the long-term results.
As many experts warned, additional research has also made clear that the academic damage of COVID was not shared equally. NWEA, the nonprofit testing group whose MAP exam has proven an invaluable assessment tool throughout the pandemic, released a study in November indicating that already-wide achievement gaps in elementary classrooms have grown between 5 and 10 percent in the last few years. Those disparities grew, NWEA analysts specified, because of slumping achievement among struggling students.
College entrance exams contributed yet another dispiriting perspective, with average scores on the ACT slipping below 20 for the first time since the presidency of George H.W. Bush. Only about one in twelve test-takers from low-income families met standards of college readiness across all of the test’s four subjects.
In 2022, researchers, educators, and the public discovered the full extent of what COVID did to K-12 learning. 2023 will provide a test of how quickly that learning can be restored — and how seriously we are approaching the problem.
The geography of remote learning
Multiple studies have identified a strong association between academic backsliding and time spent in remote learning. And while different states and districts switched back to in-person instruction at different speeds, a disturbing commonality emerged: The least-advantaged kids were usually the slowest to return to the classroom.
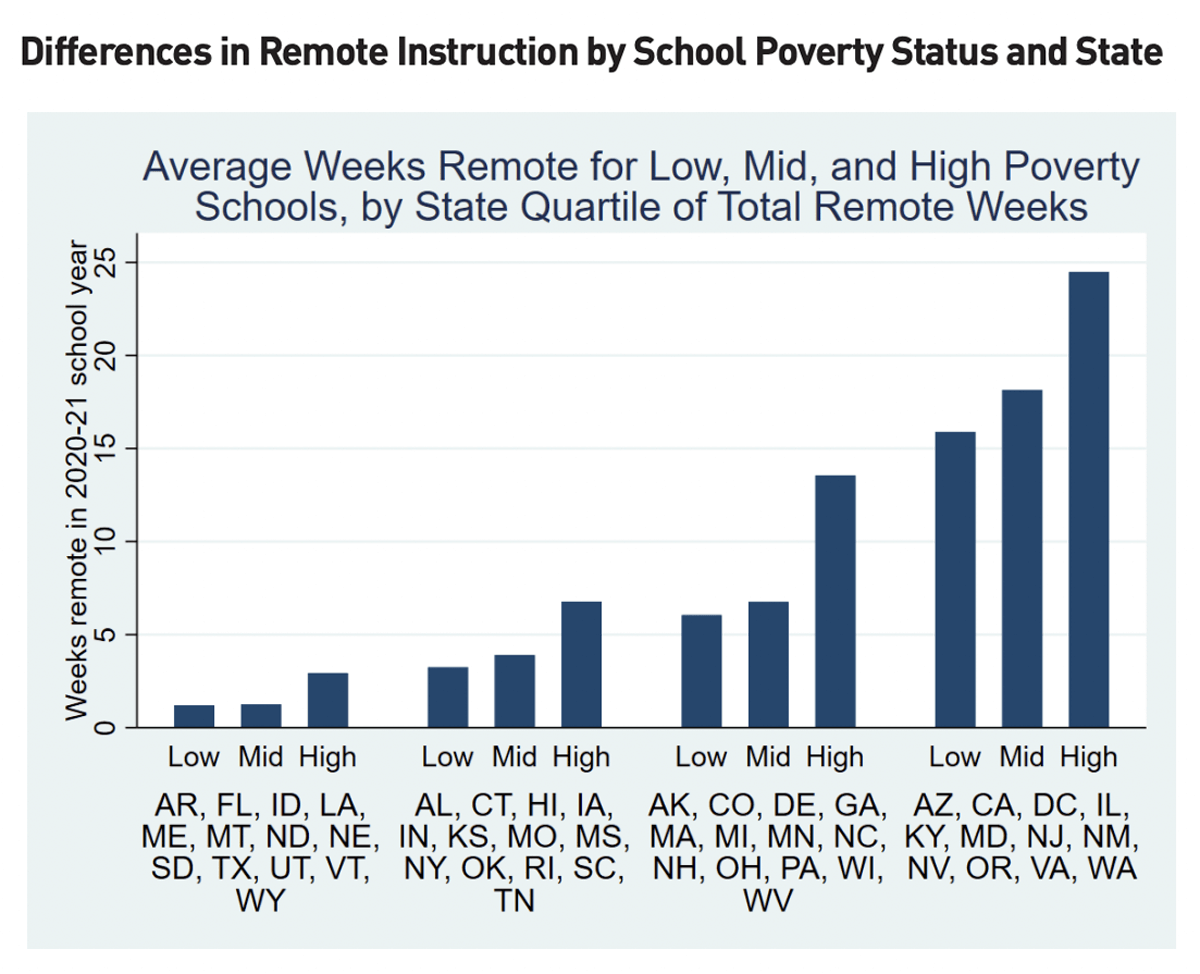
A May paper co-authored by experts at NWEA, the CALDER Center at the American Institutes for Research, and Harvard’s Center for Education Policy Research used data from over 2 million students to show that — whether in states that reopened schools relatively quickly, like Florida, or those that stayed remote much longer, like Virginia — schools serving the highest proportions of low-income students spent the most weeks remote during the 2020–21 academic year. Notably, however, the socioeconomic gaps in exposure to virtual teaching were much larger among the group of predominantly blue states that tended to reopen more hesitantly. In those states, high-poverty schools spent more than two additional months in Zoom classrooms than low-poverty schools.
Harvard economist and study co-author Thomas Kane observed that the greater prevalence of remote learning among poor students, who are already less likely to succeed academically than their better-off peers, could be an additional driver of achievement gaps for years to come. In an interview with The 74, Kane said that the academic recovery interventions planned by school districts were “nowhere near enough” to compensate for COVID’s toll.
“Based on what I’m seeing, most districts are going to find that students are still lagging far behind when they take their state tests in May 2023,” Kane said.
But was the public convinced by the reams of detailed and well-intentioned research on the results of online learning? Public polling suggests that the answer is ambiguous. At least one 2022 survey — albeit one conducted before much of the research on learning loss was released — indicated that Americans prioritized curbing the pandemic’s spread over keeping schools open.
Poorer districts lost the most
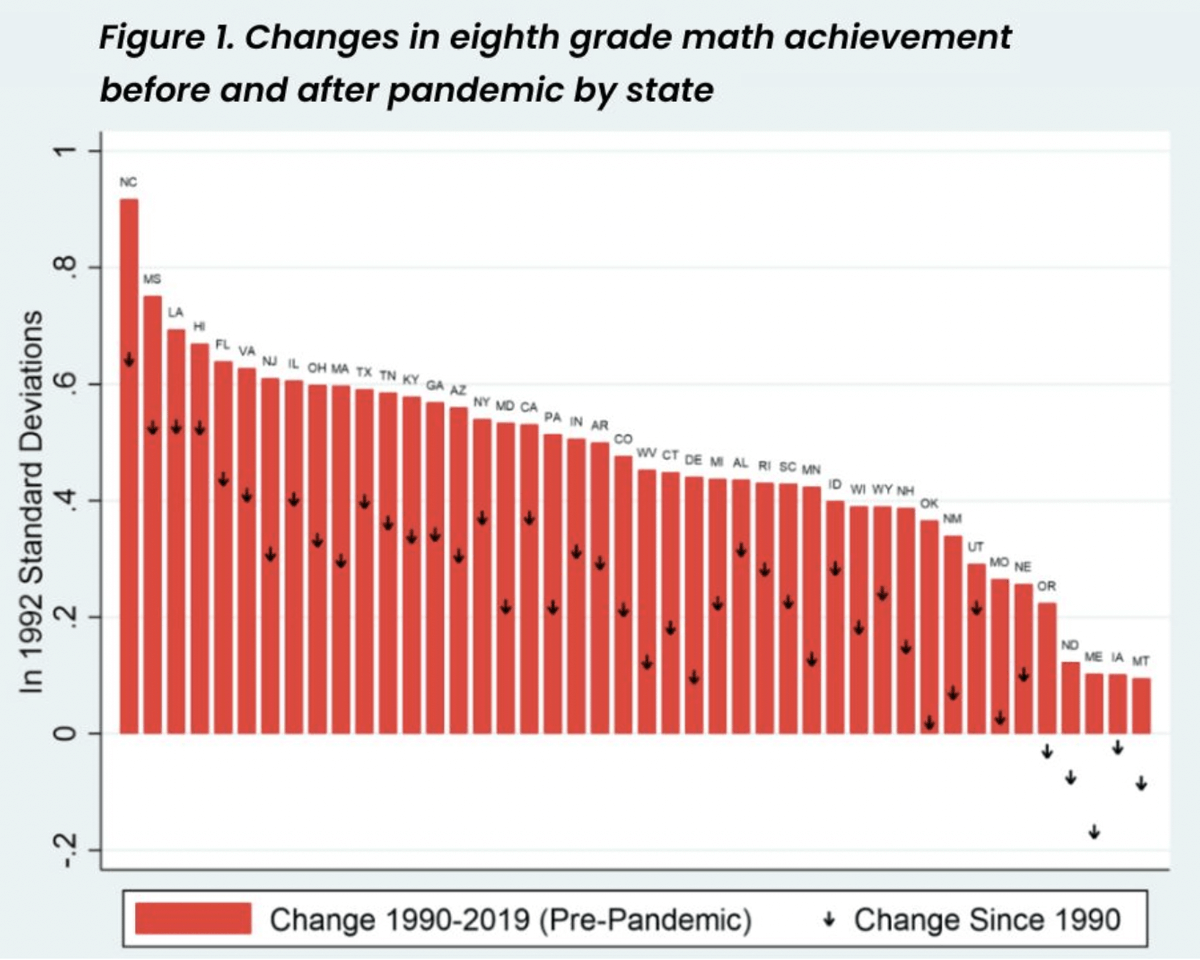
Few doubt that some amount of learning loss is linked to the hasty and unplanned adoption of remote instruction. How much is still ambiguous, however. One data tool released in October — devised by Harvard’s Kane and the eminent Stanford sociologist Sean Reardon, among others — leveraged a combination of state test scores and federal NAEP results to deliver a granular, district-by-district overview of the pandemic’s academic impact.
While the researchers found that academic performance in predominantly in-person districts held up much better than mostly remote districts within the same state, they also stipulated that school closures were not “the primary factor driving achievement losses”; some states that spent much of the pandemic open as usual, such as Maine, sustained far greater score declines than those that saw widespread closures, such as California. And beyond the question of remote-versus-in-person, it is clear that districts with greater concentrations of poor students experienced the worst academic effects over the last few years.
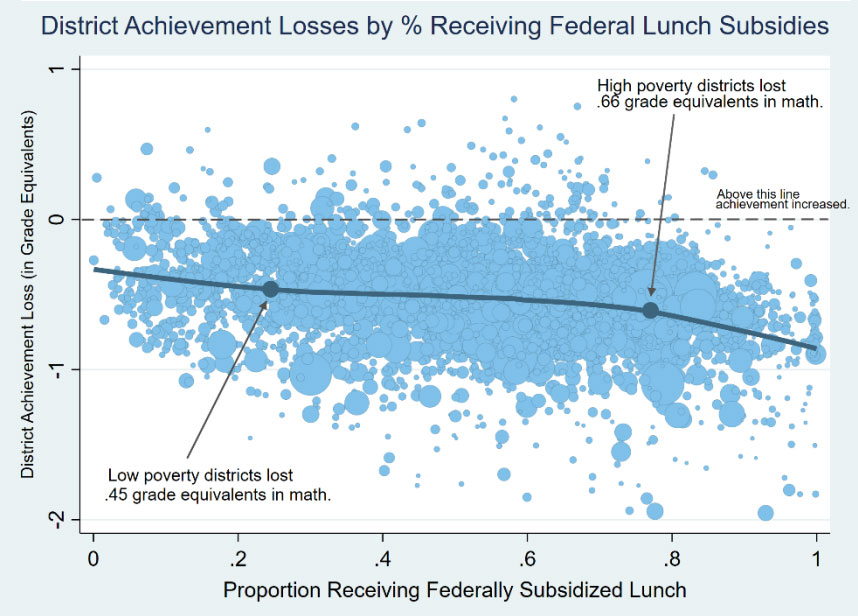
In districts where 70 percent or more of students qualified for free or reduced-price lunch, average math performance fell by 0.66 grade levels. By contrast, in districts where fewer than 39 percent of students qualified for free lunch, only 0.45 grade levels of math achievement were lost. Above all, the ultra-local look at test scores showed a startling amount of variation in how different school districts experienced the same event; in reading, almost 15 percent of all students were enrolled in districts where achievement actually grew during the pandemic.
Enrollment fell as families fled
The pandemic left an impact on schools far beyond its blow to student achievement. Due to a combination of public dissatisfaction, increased mobility, and economic upheaval, families withdrew from their public schools in unprecedented numbers — as many as 1.5 million during the 2020–21 school year, or about 3 percent of all public K-12 enrollment, according to a 2021 report from NCES.
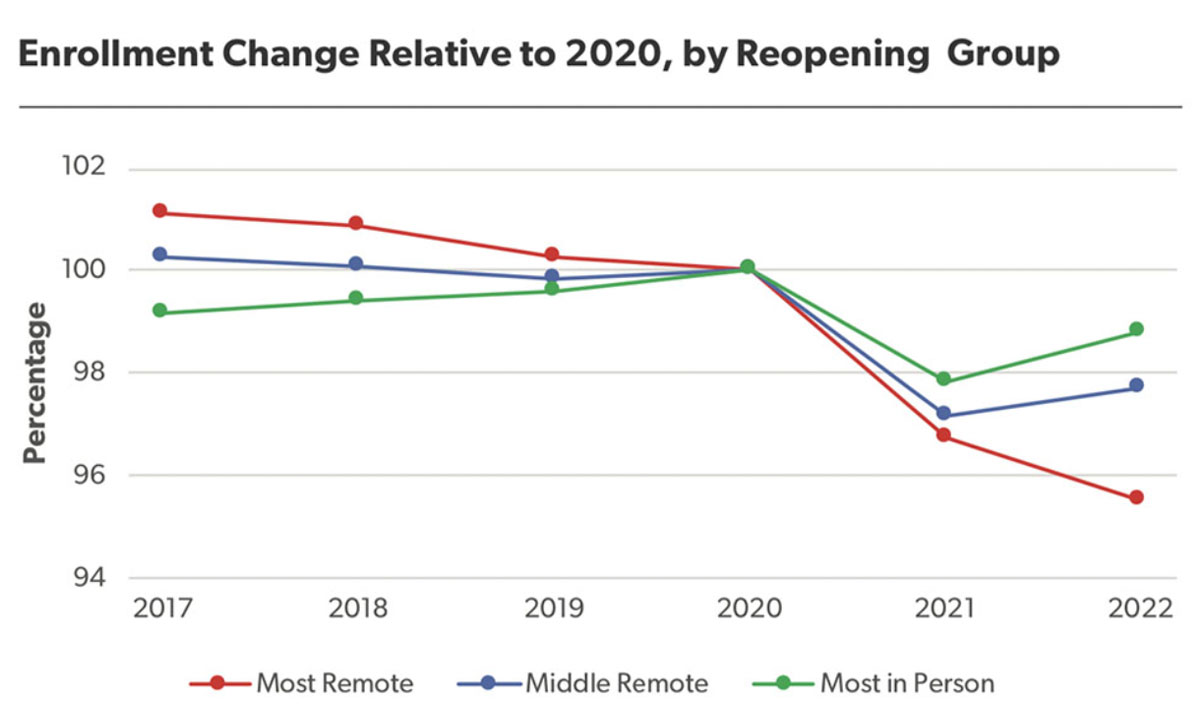
Further scholarly investigation has unearthed the important role that learning modality played in that flight. According to a comprehensive report from the conservative American Enterprise Institute, the districts that spent the most time remote throughout the first pandemic school year lost at least 500,000 more students than they would have if they had stayed open during that time. And in the period that followed, fewer students returned than did to districts where campuses mostly operated in-person.
The findings suggested that widespread loss of students was not just “pandemic-related; it was pandemic-response related,” Nat Malkus, AEI’s deputy director of education policy, told The 74’s Linda Jacobson.
Meanwhile, enrollment trends detected this spring by the data company Burbio showed that major urban districts continued losing students through the 2021–22 school year. Only a handful of states examined by the organization during that time saw an enrollment increase of more than 1 percent compared with the previous year.
The youngest weren’t spared
While we’ve gained a better empirical understanding of how K-12 students’ lives and learning trajectories were altered by COVID, it will be years before we fully grasp the ways in which the youngest Americans were affected. But a provocative study of child development and language acquisition has already given cause for alarm.
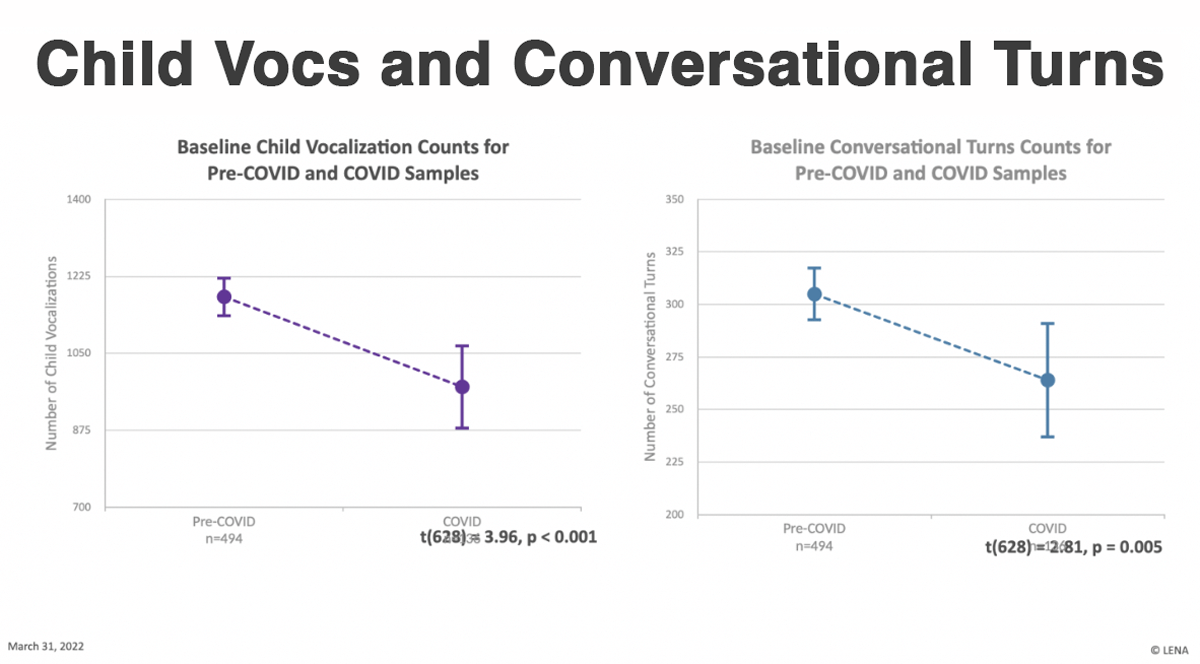
Using LENA “talk pedometers” — a wearable technology that measures the number of spoken interactions occurring in the vicinity of young children, as well as their own vocalizations — researchers at Brown discovered that babies born after July 2020 produced fewer vocalizations and demonstrated slower verbal growth than comparable children born before 2019. The younger group of babies also experienced slower growth of white matter — subcortical nerve fibers that facilitate communication between different regions of the brain — perhaps the result of hearing fewer words spoken and engaging less often with their caregivers.
If the cognitive development of young learners was slowed by the extraordinary social isolation imposed by daycare closures and lockdowns of public spaces, it will produce unavoidable consequences for schools in the next decade.
Old before their time
Even as social and intellectual growth was apparently slowed for some infants and babies, psychologists warn that the compounded stress of the last few years may have harmfully accelerated the maturation process for older kids.
A slew of surveys highlight newly elevated levels of student stress, the product of public health worries, economic anxiety, and even domestic abuse. But a recently published study offers proof that those factors actually changed the neurobiology of some adolescents. Examining MRIs of 128 matched subjects — half measured before and half after the pandemic began — a team of psychologists found that the group assessed after COVID demonstrated higher “brain age” than their chronological age and experienced faster growth in the amygdala and hippocampus, areas of the brain that regulate fear, stress, and memory.
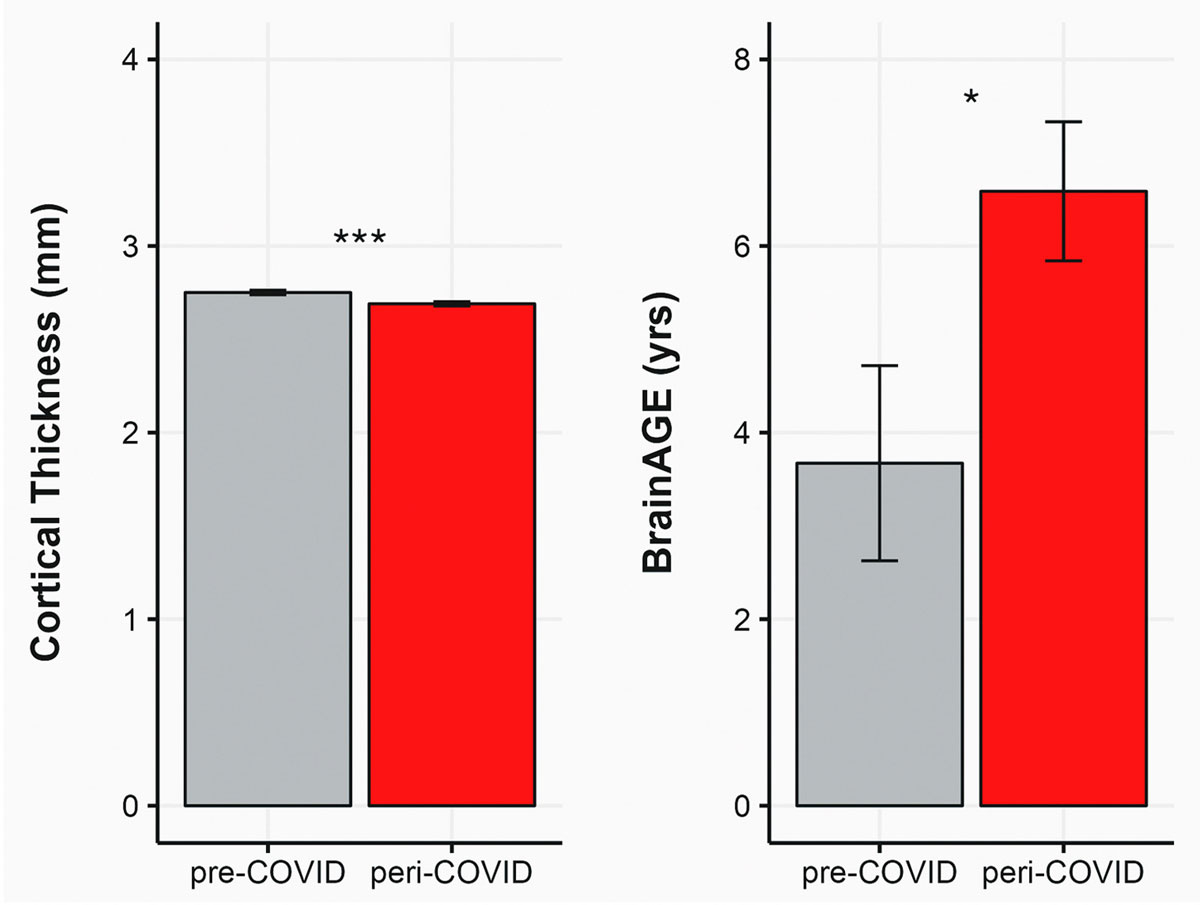
Such sped-up aging has historically been seen in cases of household trauma and neglect, and its consequences can include decreased capacity across a range of intellectual functions. Follow-up scans are already planned to assess whether the process has been remediated.
Teachers under strain
Eamonn Fitzmaurice/The 74/iStock
Adults in schools have shown their own signs of exhaustion. In a survey of nearly 4,000 K-12 teachers and principals conducted by the RAND Corporation, about one-third said they intended to quit their jobs, a significantly higher proportion than it found during the chaotic pandemic months of early 2021.
That figure almost certainly doesn’t betoken a future exodus from the profession; educators have historically been much more likely to say they intend to leave than to ultimately act on those plans. But it could mean that large numbers will stay in their jobs past the point of burnout, their effectiveness permanently dimmed. On average, the poll found that the teachers and principals were more than twice as likely to report experiencing frequent, job-related stress than other workers.
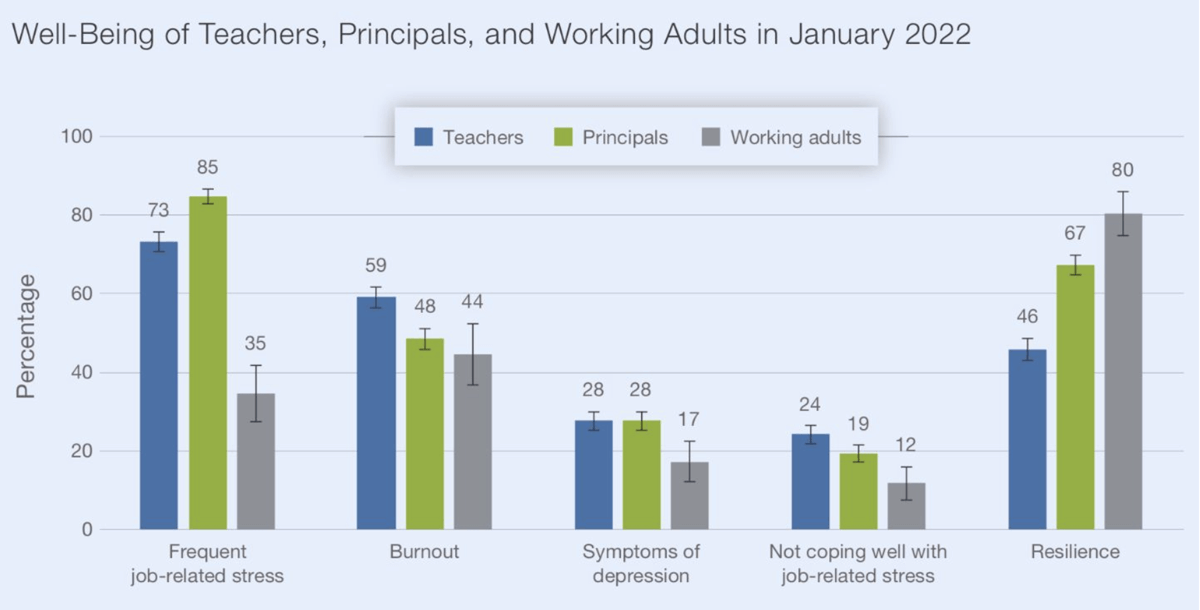
Teachers were also twice as likely as comparable adults to say they were not “coping well” with their stress. While the most commonly cited contributing factor was the task of addressing learning loss, some school employees also complained of staff shortages and the difficulty of managing their own childcare responsibilities.
Social shuffle
It shouldn’t come as any surprise that young adults’ personal relationships, no less than their academic prospects, were fundamentally changed by months spent away from their peers.
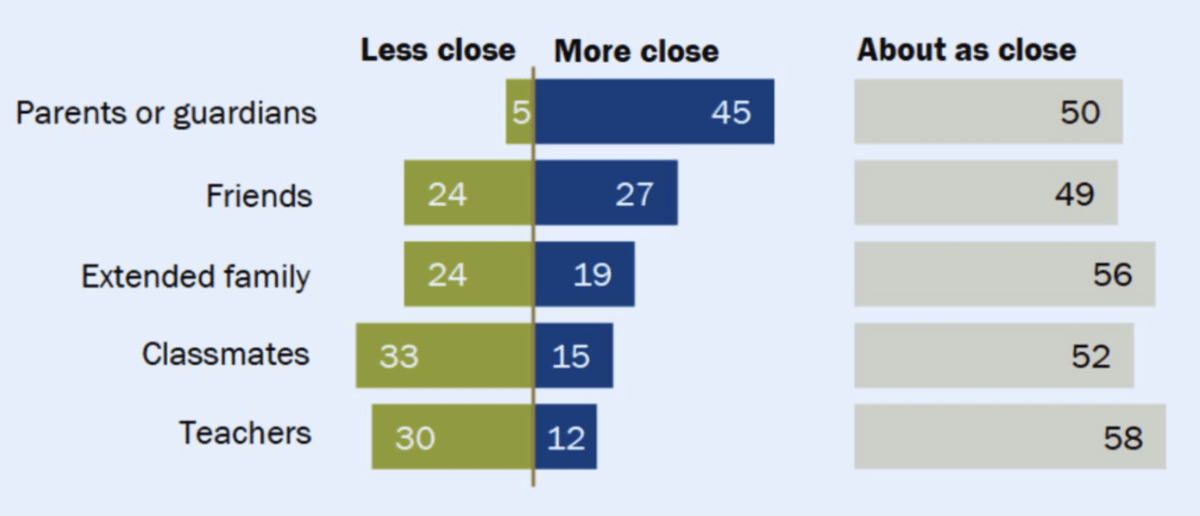
In some ways, those changes were positive: According to a June poll released by Pew, 45 percent of American kids between the ages of 13 and 17 said they felt closer to their parents after two years of disrupted schooling. But sizable minorities also reported feeling less close to friends, classmates, teachers, and extended family, a web of social connections that might have proven vital during a lengthy period of difficulty.
Somewhat surprisingly for a survey administered over two years after the emergence of COVID, nearly 20 percent of the teen respondents said they had not attended classes exclusively in-person during the spring of 2022 (a time of somewhat elevated virus case rates). About two-thirds said they would prefer a return to entirely in-person schooling in the future.
Future earnings endangered
The downstream consequences of thwarted or deferred academic success are destined to include financial disadvantages; after all, today’s underserved pupils are tomorrow’s underprepared workers. But until the fall release of NAEP, it was difficult to produce a broadly shared measure of American students’ stifled progress.
With the arrival of those scores, Harvard economist Kane — him again — and Dartmouth professor Douglas O. Staiger immediately calculated a projection of how much potential income could be lost due to diminished math learning among eighth-graders since 2020. Based on the historical correlation between math gains on NAEP and professional earnings growth, the figure they reached was astounding: $900 billion of future earnings, if the declines in learning were to remain permanent for all students in the United States.
“When there are improvements in scores, those kids coming out of school are going to have better outcomes later in life,” Staiger told The 74. “And we can infer from this recent decline that all the cohorts in school now are going to do a bit worse than we expected.”
The paper was one of a series of analyses focusing specifically on the drop in math knowledge, which appears to have been particularly significant. But the extended disruption to literacy instruction left a substantial mark as well, particularly among students at the beginning of their reading careers. Amplify, a curriculum provider, released data this fall showing that 4 percent fewer second graders and 8 percent fewer first graders are reaching grade-level reading goals than in 2019; meanwhile, almost one-third of third graders were assessed as needing “intensive intervention.”
Those bleak findings echo the results of Curriculum Associates’ i-Ready assessment, which revealed that the percentage of elementary students reading below grade level grew between 2021 and 2022. That subgroup of students, sometimes called the “COVID cohort,” is running out of time to get back on track.
Costs of recovery
The havoc inflicted by the pandemic is now an inescapable fact for schools, families, and public authorities to deal with. But what’s it going to take to surmount the considerable educational challenges and get kids back on track?
The federal government has allocated roughly $190 billion in relief funding to states for that purpose. But according to researchers Kenneth Shores and Matthew Steinberg, that amount won’t be sufficient to get the job done. The true cost, they say, will fall somewhere between $325 billion and $930 billion, huge sums that include not only the pedagogical resources to restore lost learning opportunities from the last several years, but also the out-of-school interventions that power so much of the academic growth that goes on inside classrooms.
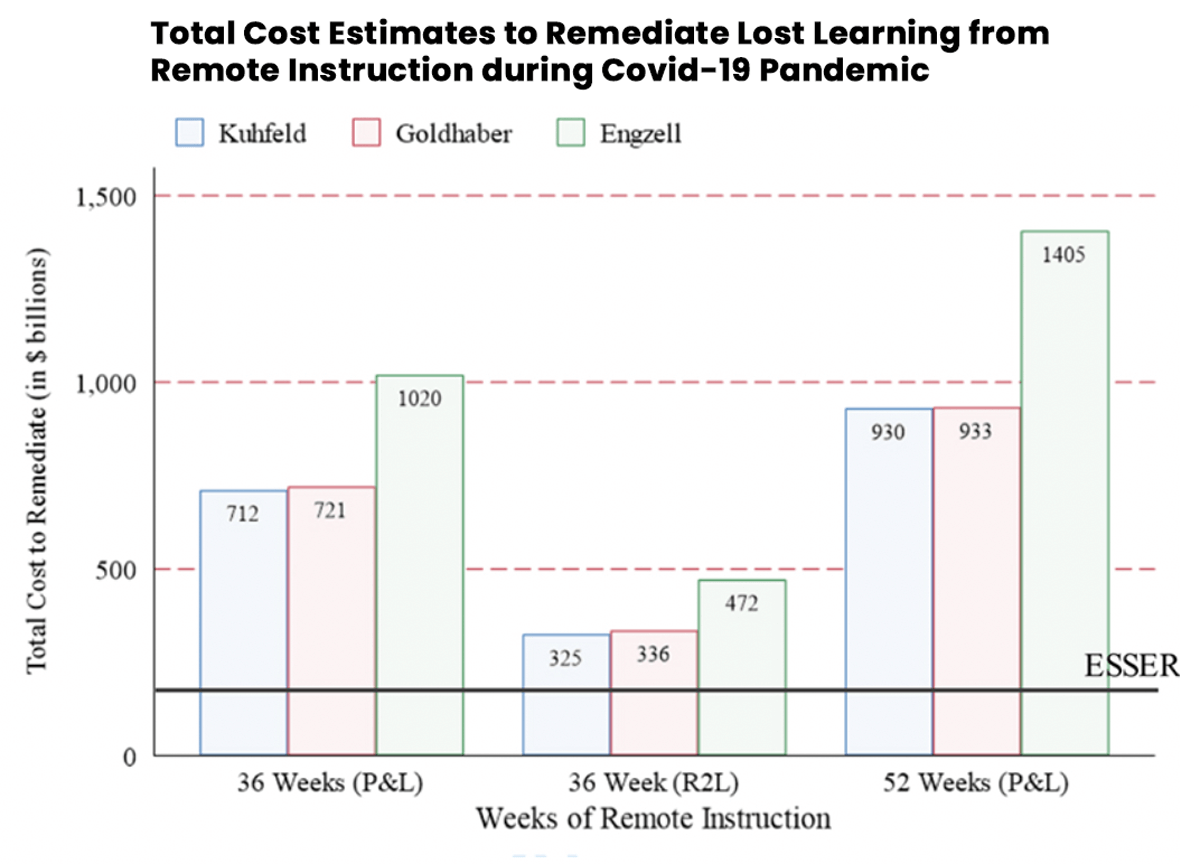
There is no indication that anywhere near that level of funding — or even any further money at all — is coming. In the meantime, school districts are only required to spend 20 percent of their federal aid on learning recovery.
Latino students take a hit
Children of all backgrounds were bruised by the effects of shuttered schools, but among them, Latino students are notable for having recently enjoyed sustained academic momentum. As their share of the national student body has increased to nearly 30 percent, they have also seen rising achievement scores and post-secondary outcomes compared with their parents’ and grandparents’ generations.
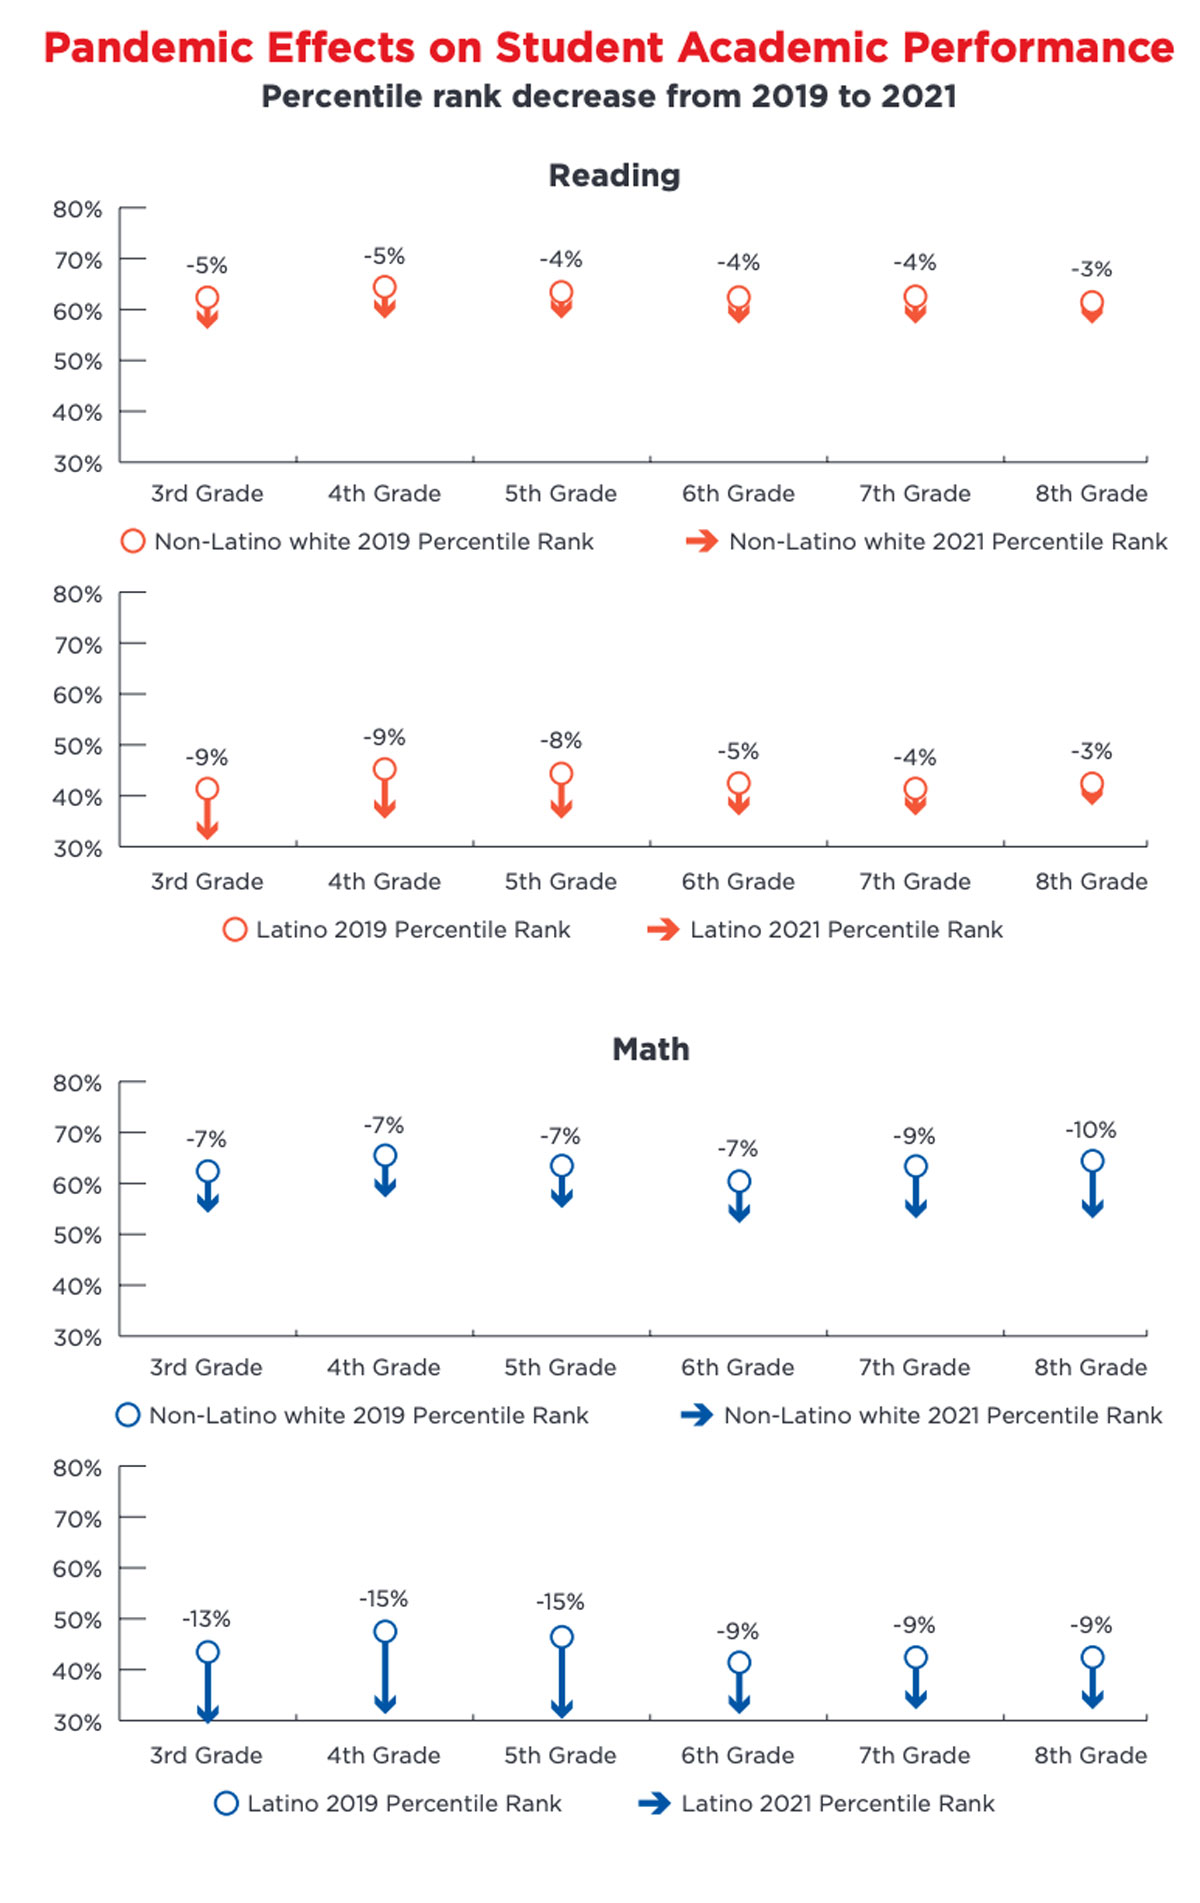
COVID put that progress on pause, according to a July report from the advocacy organization UnidosUS. After leaping from 71 percent to 82 percent over the last decade, the on-time high school graduation rate for Latino students fell slightly in 2021. Worse still, the rate of college enrollment for Latino freshmen shrunk by 7.8 percent between the spring of 2020 and 2021. That figure bounced back somewhat over the next academic year — along with rates of college-going for most Americans — but still fell below the pre-pandemic norm.
The particular stumbles experienced by Latino kids have explanations that both precede the pandemic and are directly linked to it, the report found. Long before 2020, Latino households were less likely to report having a computer or high-speed broadband in the home. Meanwhile, Latino students were disproportionately likely to be enrolled in low-income schools, which were themselves more likely to stay remote longer during the pandemic.
Eamonn Fitzmaurice/The 74/iStock
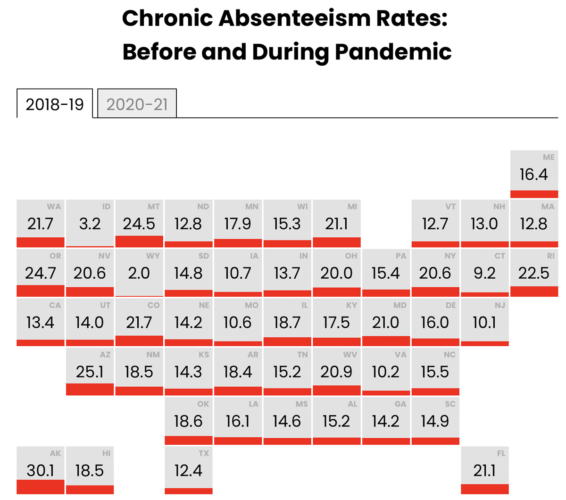
Explosion of absenteeism
Along with the surge of full-on disenrollment from schools, a shocking number of K-12 students spent the last few years missing day after day of instruction. Just how many days of absence is difficult to know precisely, however, because of ambiguities in the way attendance figures were collected during the COVID era.
An NCES brief released this fall indicated that over 10 million students were chronically absent (i.e., missing over 10 percent of the school year) in 2020–21. That would be an increase of more than 25 percent relative to the pre-pandemic norm, but according to a team of analysts from Johns Hopkins University and the nonprofit group Attendance Works, it is also very likely a serious underestimate. Because of challenges in knowing which students “attended” all of their virtual lessons (versus simply logging into Zoom and then logging off, for instance), statewide absence counts in the NCES figures sometimes vary widely from district-level reporting.
Based on the early release of more detailed 2021–22 figures from California, Connecticut, Ohio, and Virginia, the authors wrote, it is reasonable to predict that as many as 16 million kids were chronically absent last school year, a doubling of the pre-pandemic number.
The teacher exodus that wasn’t
Were American schools plagued with teacher absences this year, or not? It was a question that captivated news sources, but also divided education experts, because it contained an even thornier question within it: If the supply of teachers remains mostly steady, but demand for them spikes, are they truly at a deficit?
In spite of widespread fears that veteran teachers were quitting in huge numbers as a reaction to the pandemic, no mass departure ever took place, according to a paper by Brown economist Matt Kraft. Turnover actually fell slightly in the summer of 2020 and stayed within the typical annual range the next year. But weak hiring during the first few months of the pandemic may have contributed to higher-than-usual vacancy rates, perhaps triggered by fears of Great Recession-style budget cuts that never materialized.
In fact, a windfall of federal cash followed instead, leading districts to add new jobs in late 2020 and 2021, and the resultant hiring spree has indeed made candidates for teaching positions hard to find. But even that phenomenon isn’t true everywhere, since numbers differ widely across state lines. According to a paper released this summer, Mississippi’s rate of vacancies per 10,000 students is more than 68 times higher than that of Utah.
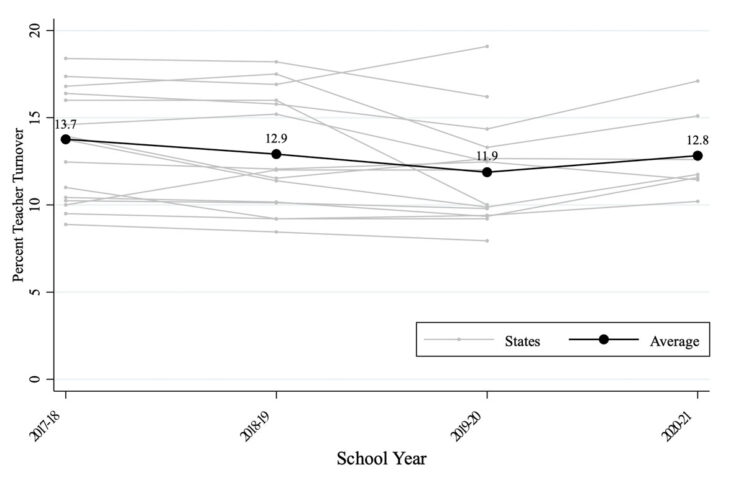
State teacher turnover across time
Hopeful signs
As the long legacy of COVID grew clearer, research in 2022 gave the education world plenty of reasons to worry. But it has also contributed some hopeful signs of renewed progress in schools.
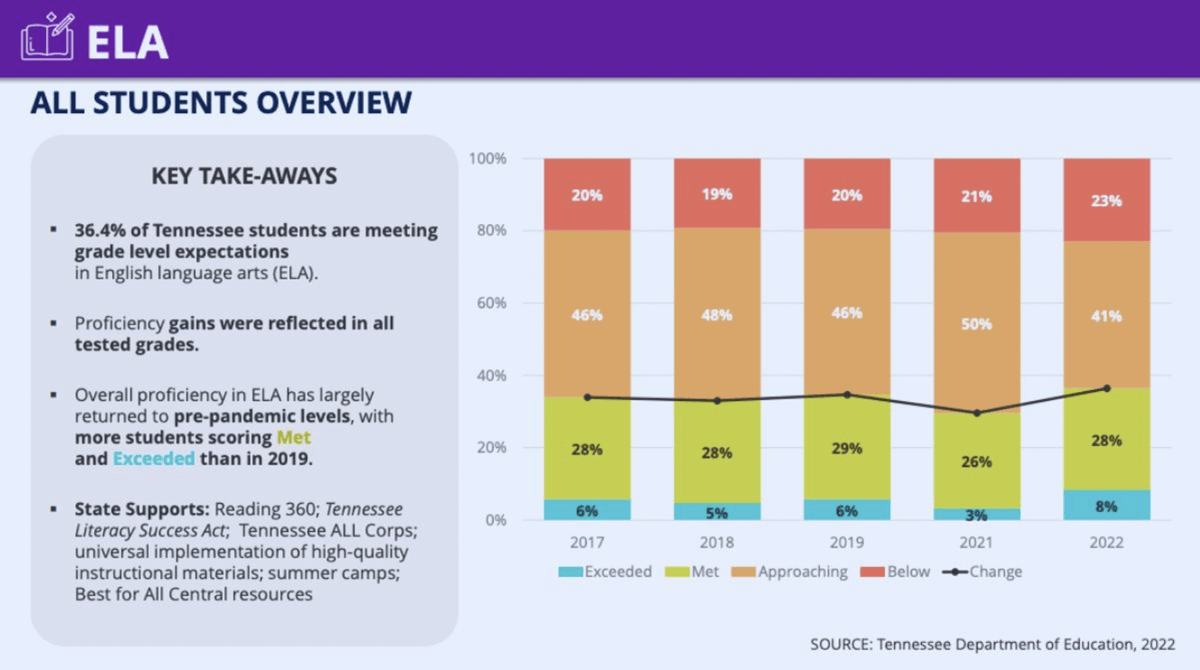
The good omens aren’t popping up everywhere, but some are to be found in state-level testing, which has resumed around the country after being suspended for at least the first pandemic year. According to Tennessee’s state exams, the number of students meeting or beating grade-level reading standards rose from 29 percent in 2020–21 to over 36 percent in 2021–22. In all, more than three-quarters of the state’s school districts reported reading scores higher than were seen in the pre-pandemic period.
“We are seeing this broadly across the state, and across district types — urban, rural and suburban,” Tennessee Education Commissioner Penny Schwinn told The 74’s Beth Hawkins. “We are really, really proud of what our districts have done.”
Several other Southern states have begun to make their turnaround, with Mississippi a particular standout. This summer’s release of 2021–22 testing data showed average scores in math, English, and science nearing or exceeding 2019 levels, while performance on the U.S. history exam skyrocketed compared with 2020–21 (the first in which it had been given). Just as notably, passage rates on the state’s third-grade “reading gate” — a state-mandated test that students must pass to progress to the fourth grade — fell by only .6 percentage points between 2019 and 2022.
This article was published in partnership with The 74. Sign up for The 74’s newsletter here.