March Madness: If the tournament celebrated colleges for moving grads up the income ladder, both California State University Long Beach & San Diego State would make the Sweet 16
Jorge Klor de Alva | March 21, 2024
Your donation will help us produce journalism like this. Please give today.
 With all that’s going wrong around the world, and given the nation’s increasing disillusionment with higher education, it is a special treat for basketball fans to be able to turn their attention to March Madness. For us, it’s time to celebrate athletes and their schools by turning our attention to our alternative bracket to the NCAA men’s Division I basketball tournament.
Since 2017, we have taken this opportunity, when Americans are debating which are the best college teams on the court, to examine which are best at helping their students succeed after they leave school.
Our Social Mobility Tournament Bracket plots the tournament’s colleges by how well — or how poorly — they put their students on a path leading to the American Dream of upward mobility.
This may not matter to the lucky players talented enough to be drafted by the NBA (a mere one in 75 of those playing in the tournament). But their not-so-fortunate classmates will likely face an uncharted trajectory of adult responsibilities after graduation.
While all colleges are supposed to instill in their students the skills, habits and knowledge they will need to have rewarding careers, those serving large numbers of low- and moderate-income students have a special obligation to make sure they are doing the right thing. That’s why our parallel bracket of winners and losers celebrates success in fostering economic mobility for all rather than the athletic prowess of a few.
From 2017 to 2022, our Social Mobility Tournament Bracket used the Harvard-based Opportunity Insights dataset to spotlight the extent to which disadvantaged students enrolled in the tournament’s colleges managed to reach family-sustaining earnings by their early 30s. That dataset, based on the percentage of students born to parents in the bottom 40% of income distribution who reached earnings in the upper 40% of household income, is now too limited for our purpose.
Growing concerns about college access, affordability and post-graduation earnings demand more comprehensive tools by which to understand the value of higher education. Consequently, beyond how effectively schools help make intergenerational advancement possible, it is important to know which colleges are worth the cost of tuition in time and money; how long a student will have to work to pay off that debt; and what proportion of each college’s underresourced students is being placed on the path to financial security.
With that in mind, since last year we have used a dataset developed and analyzed by Michael Itzkowitz, former director of the U.S. Department of Education’s College Scorecard. His Economic Mobility Index (EMI) ranks 1,320 bachelor’s degree-granting institutions by how well each provides economic mobility for its students.
Using publicly available information from the U.S. Department of Education and the Census Bureau, he first determined the return on investment that lower-income students obtain at each school by calculating the out-of-pocket costs required to obtain a four-year degree. He then considered the additional financial benefits students obtain by attending one of these schools — an earnings premium representing the extra income these graduates make in comparison with someone with only a high school diploma. The lower the out-of-pocket costs and the higher the earnings premium, the faster a student will receive a return on the investment needed to obtain the degree.
The EMI also considers the proportion of lower- and moderate-income students enrolled. If a college provides a very strong return on investment to lower-income students but most come from upper-class backgrounds, it cannot be said to provide meaningful economic mobility. Therefore, the EMI rewards schools for the proportion of lower- and moderate-income students it enrolls in addition to the return on investment it provides.
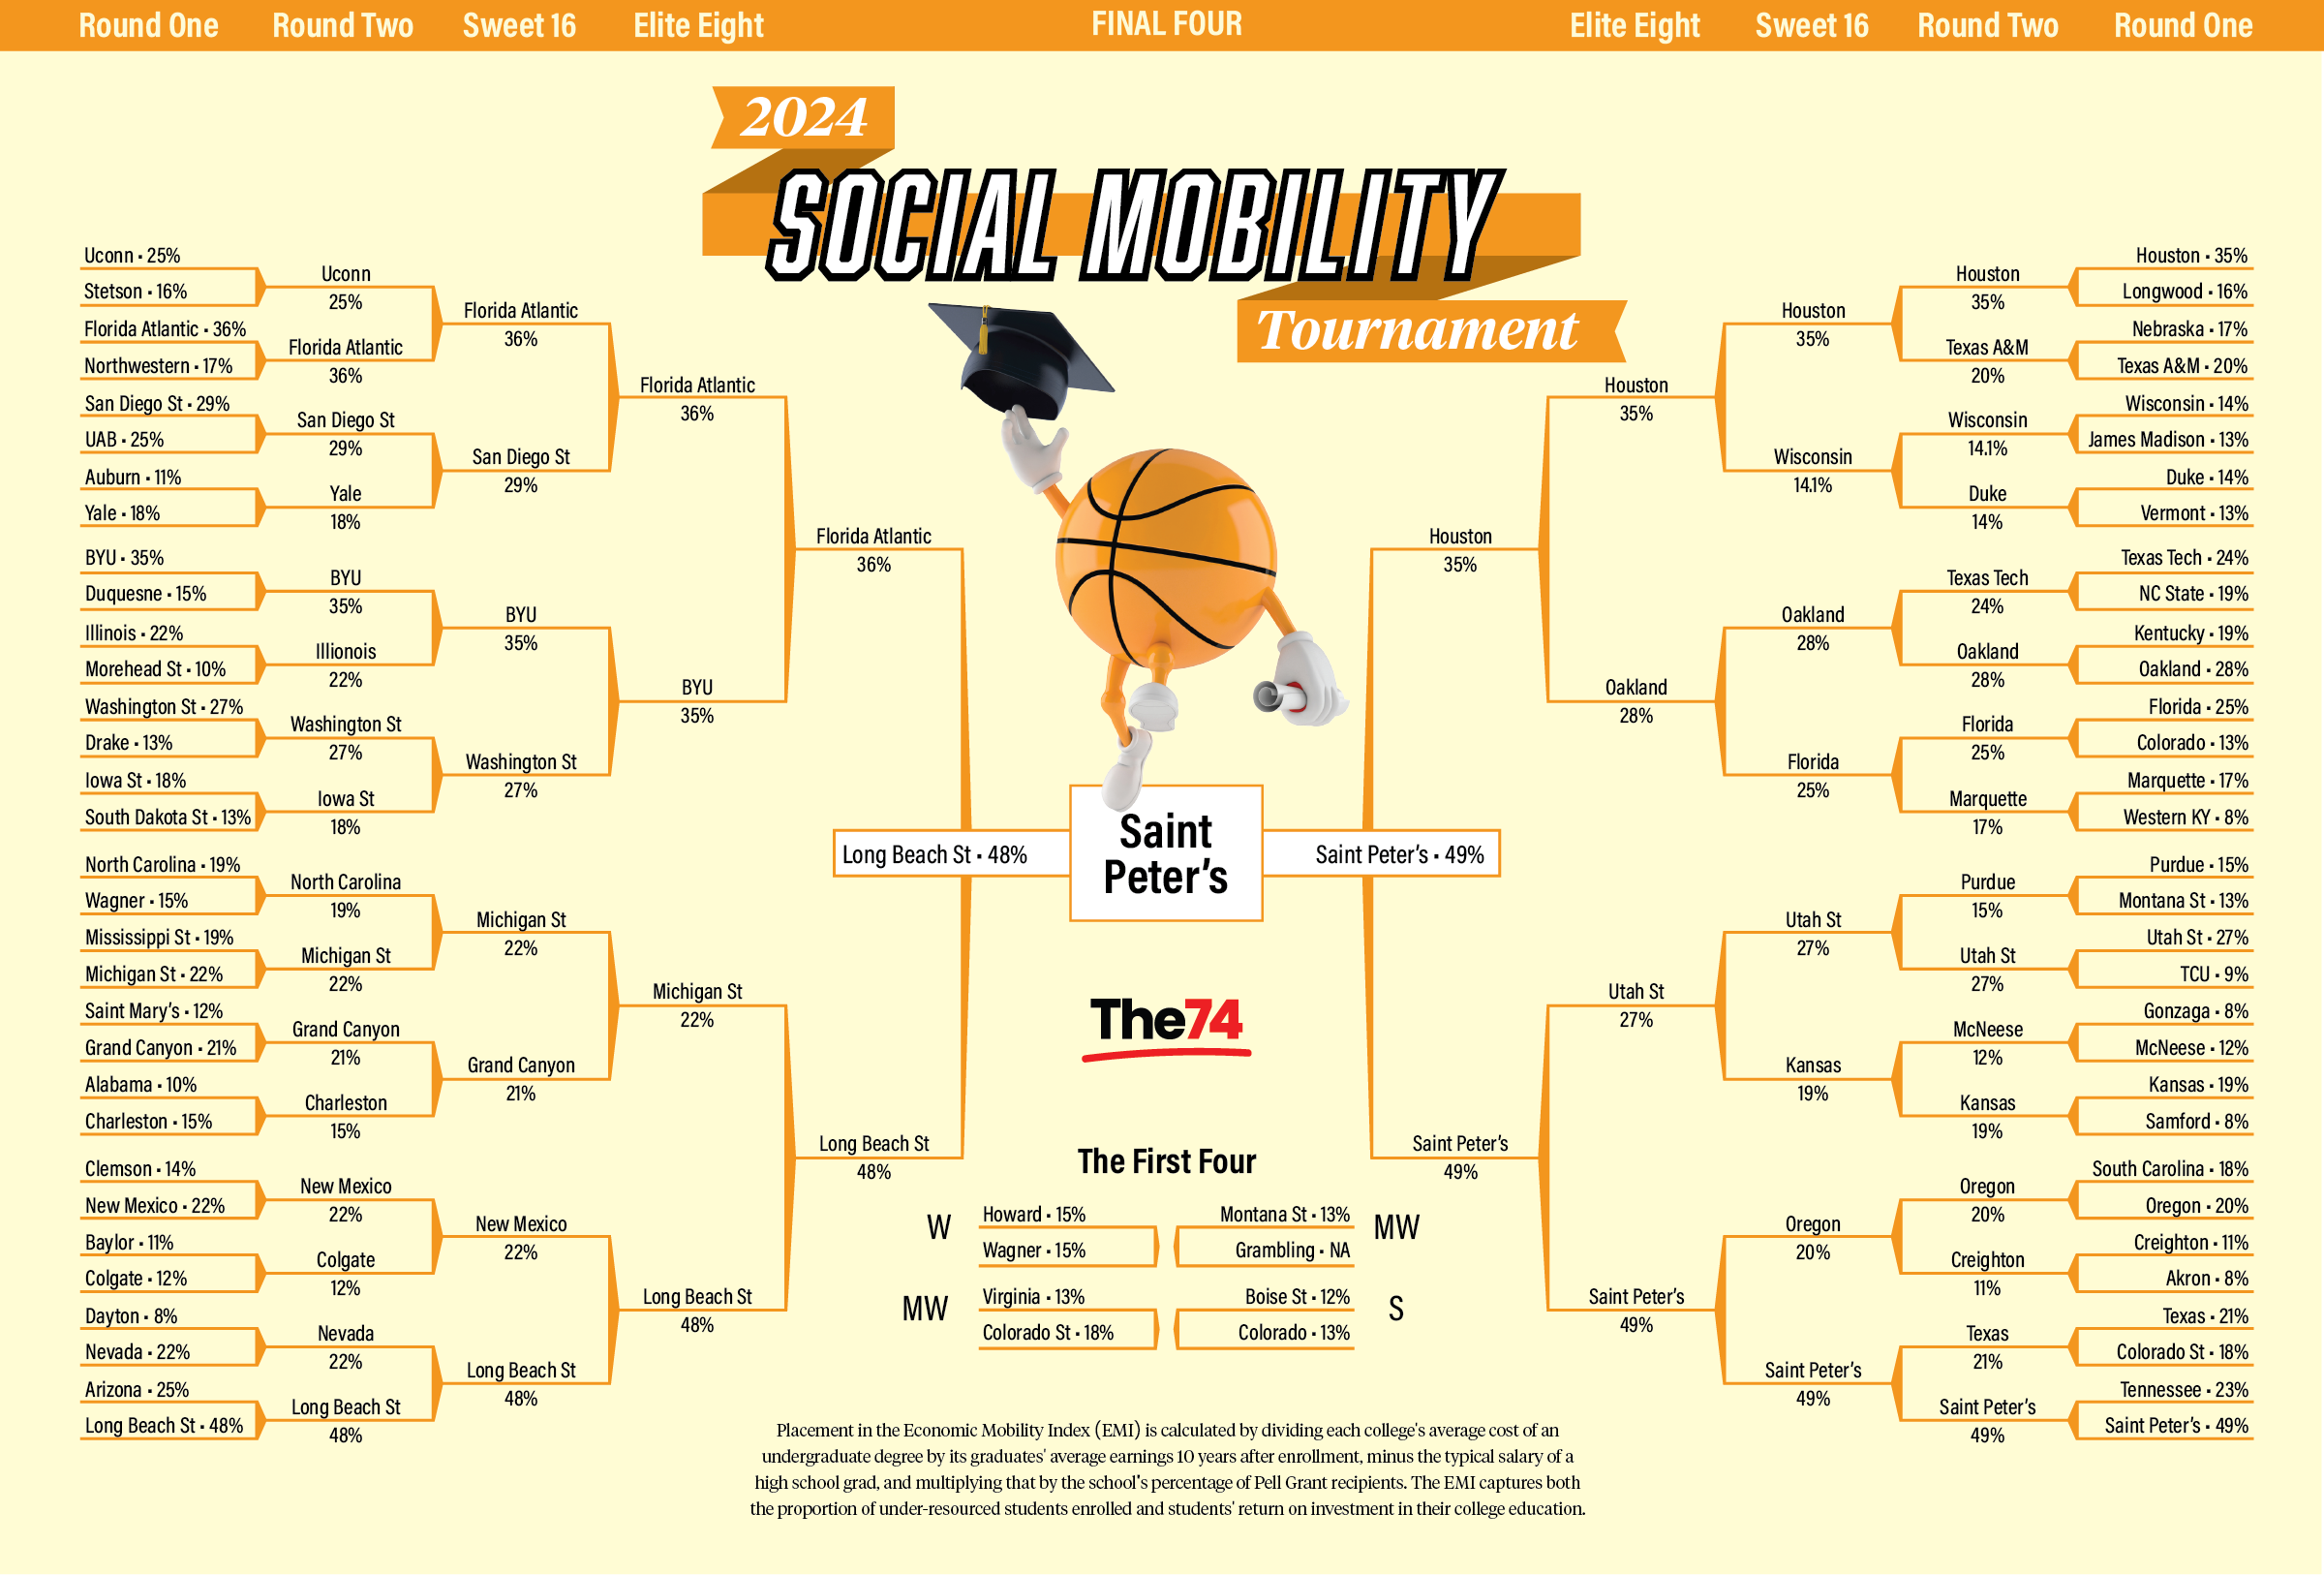
Click to see a larger image of the bracket and where your college stacks up.
Most colleges that help provide social mobility for significant numbers of low- and middle-income students tend to be public. So it’s no surprise that 23 of the 32 in the second round are public. Given their focus on access to a high percentage of Pell Grant-eligible students and their relatively low tuition, these schools make it possible for their graduates to pay down the total net cost of their education in less than two years, on average.
That said, this year’s Sweet Sixteen includes three private universities: Brigham Young, Grand Canyon and Saint Peter’s. The Sweet Sixteen were all ranked on the EMI above 371 (out of 1,320) and enjoyed an EMI average of 28.6% (on a range of 0 to 66.7%). These are exceptional numbers when one considers that these colleges are educating nearly 454,000 undergraduates, over 34% of whom are in households with gross adjusted incomes rarely higher than 225% of their state’s poverty guideline.
But to reach the social mobility Elite Eight, a high order of accomplishments was required. With the exception of the Michigan State Spartans, whose school ranked 332nd on the index, the rest of the pack came in above 165th in rank, all while serving an undergraduate population that on average is 40% eligible for Pell Grants. Which brings us to the 2024 social mobility Final Four: the Owls of Florida Atlantic (last year’s winner), the Cougars of Houston, the Beach of Long Beach State and this year’s Social Mobility Tournament Champion, the Peacocks of St. Peter’s. All were ranked above 66th in the index, had EMI scores above 48% and served student bodies with over 48% Pell recipients.
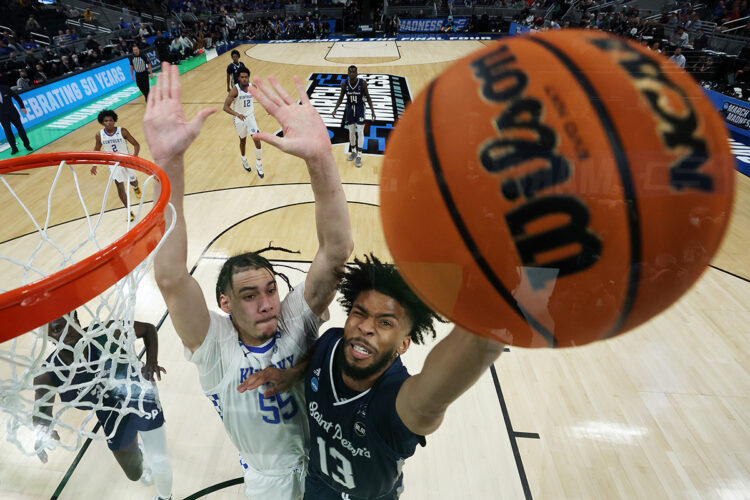
Andy Lyons/Getty Images
St. Peter’s is a winner on and off the court. Two years ago, the team defeated mighty Kentucky on its way to the NCAA tournament‘s Elite Eight. This year, the 15th-seeded Peacocks return to the Big Dance having won the MAAC Tournament. Meanwhile, all 2,640 undergraduates receive financial aid and over 62% have Pell Grants. That, coupled with low tuition ($36,900 per degree) and an earnings premium of nearly $16,000 beyond what a high school grad would earn, makes it possible for St. Peters students to pay down the cost of their degree in just 2.3 years.
At 17th in the index and with a 49% EMI rank, St. Peter’s is a most deserving champion of our 2024 Social Mobility Tournament.