In March Madness social mobility women’s tourney, Sac State wins big
Jorge Klor de Alva | March 23, 2023
Your donation will help us produce journalism like this. Please give today.
Eamonn Fitzmaurice/LA School Report
For the last six years, I have drawn up a parallel bracket that plots the winners and losers in the NCAA Men’s Division I basketball tournament — aka March Madness — not by how the schools have done on the court, but by how well they have made upward mobility possible for their students. Now, for the first time, I have done the same for the colleges participating in the NCAA Women’s tournament.
In the past, I used data that permitted one to determine the percentage of a college’s students born to low-income parents who by their 30s managed to reach earnings in the upper 40% of household income. This intergenerational measure of upward mobility is useful, but it gives little insight into the factors that help or hinder students’ access to a better life, such as how long it will take to pay off the cost of their education. The data also failed to spell out the extent, in comparison to other schools, to which each college promotes the mobility of low- and moderate-income students.
To address these concerns, this year I used an Economic Mobility Index (EMI) prepared for Third Way by Michael Itzkowitz, former director of the U.S. Department of Education’s College Scorecard. The EMI ranks 1,320 bachelor’s degree-granting institutions by how well each provides economic mobility for its students. All the colleges in the 2023 NCAA women’s tournament are found in this index.
To assess the degree of economic mobility the tournament schools provide their less-resourced students, the percentage of Pell Grant recipients (a proxy for low family income) at each college is multiplied by its percentile rank on return on investment (ROI) that the school offers these students versus other colleges.
The ROI itself is obtained from the total out-of-pocket cost of attaining a degree and how much more a bachelor’s recipient earns 10 years after enrolling in college than a high school graduate. For example, if a four-year college costs $60,000 and its graduates earn $15,000 more than they would have without a bachelor’s, it would take them approximately four years to recoup their education costs ($60,000 in costs divided by $15,000 in additional earnings). The result of multiplying a college’s percentile rank on its ROI for lower-income students by its proportion of such students determines its placement within the EMI. Therefore, the EMI captures both the proportion of underresourced students served and the strength of the return graduates receive from their educational investment.
The importance of these calculations is this: If a school provides a very strong ROI to lower-income students but enrolls mostly those from middle- and upper-class backgrounds, it cannot be said to be a good source of economic mobility. Therefore, the EMI rewards schools for both their proportion of lower- and moderate-income students and the additional ROI it provides them.
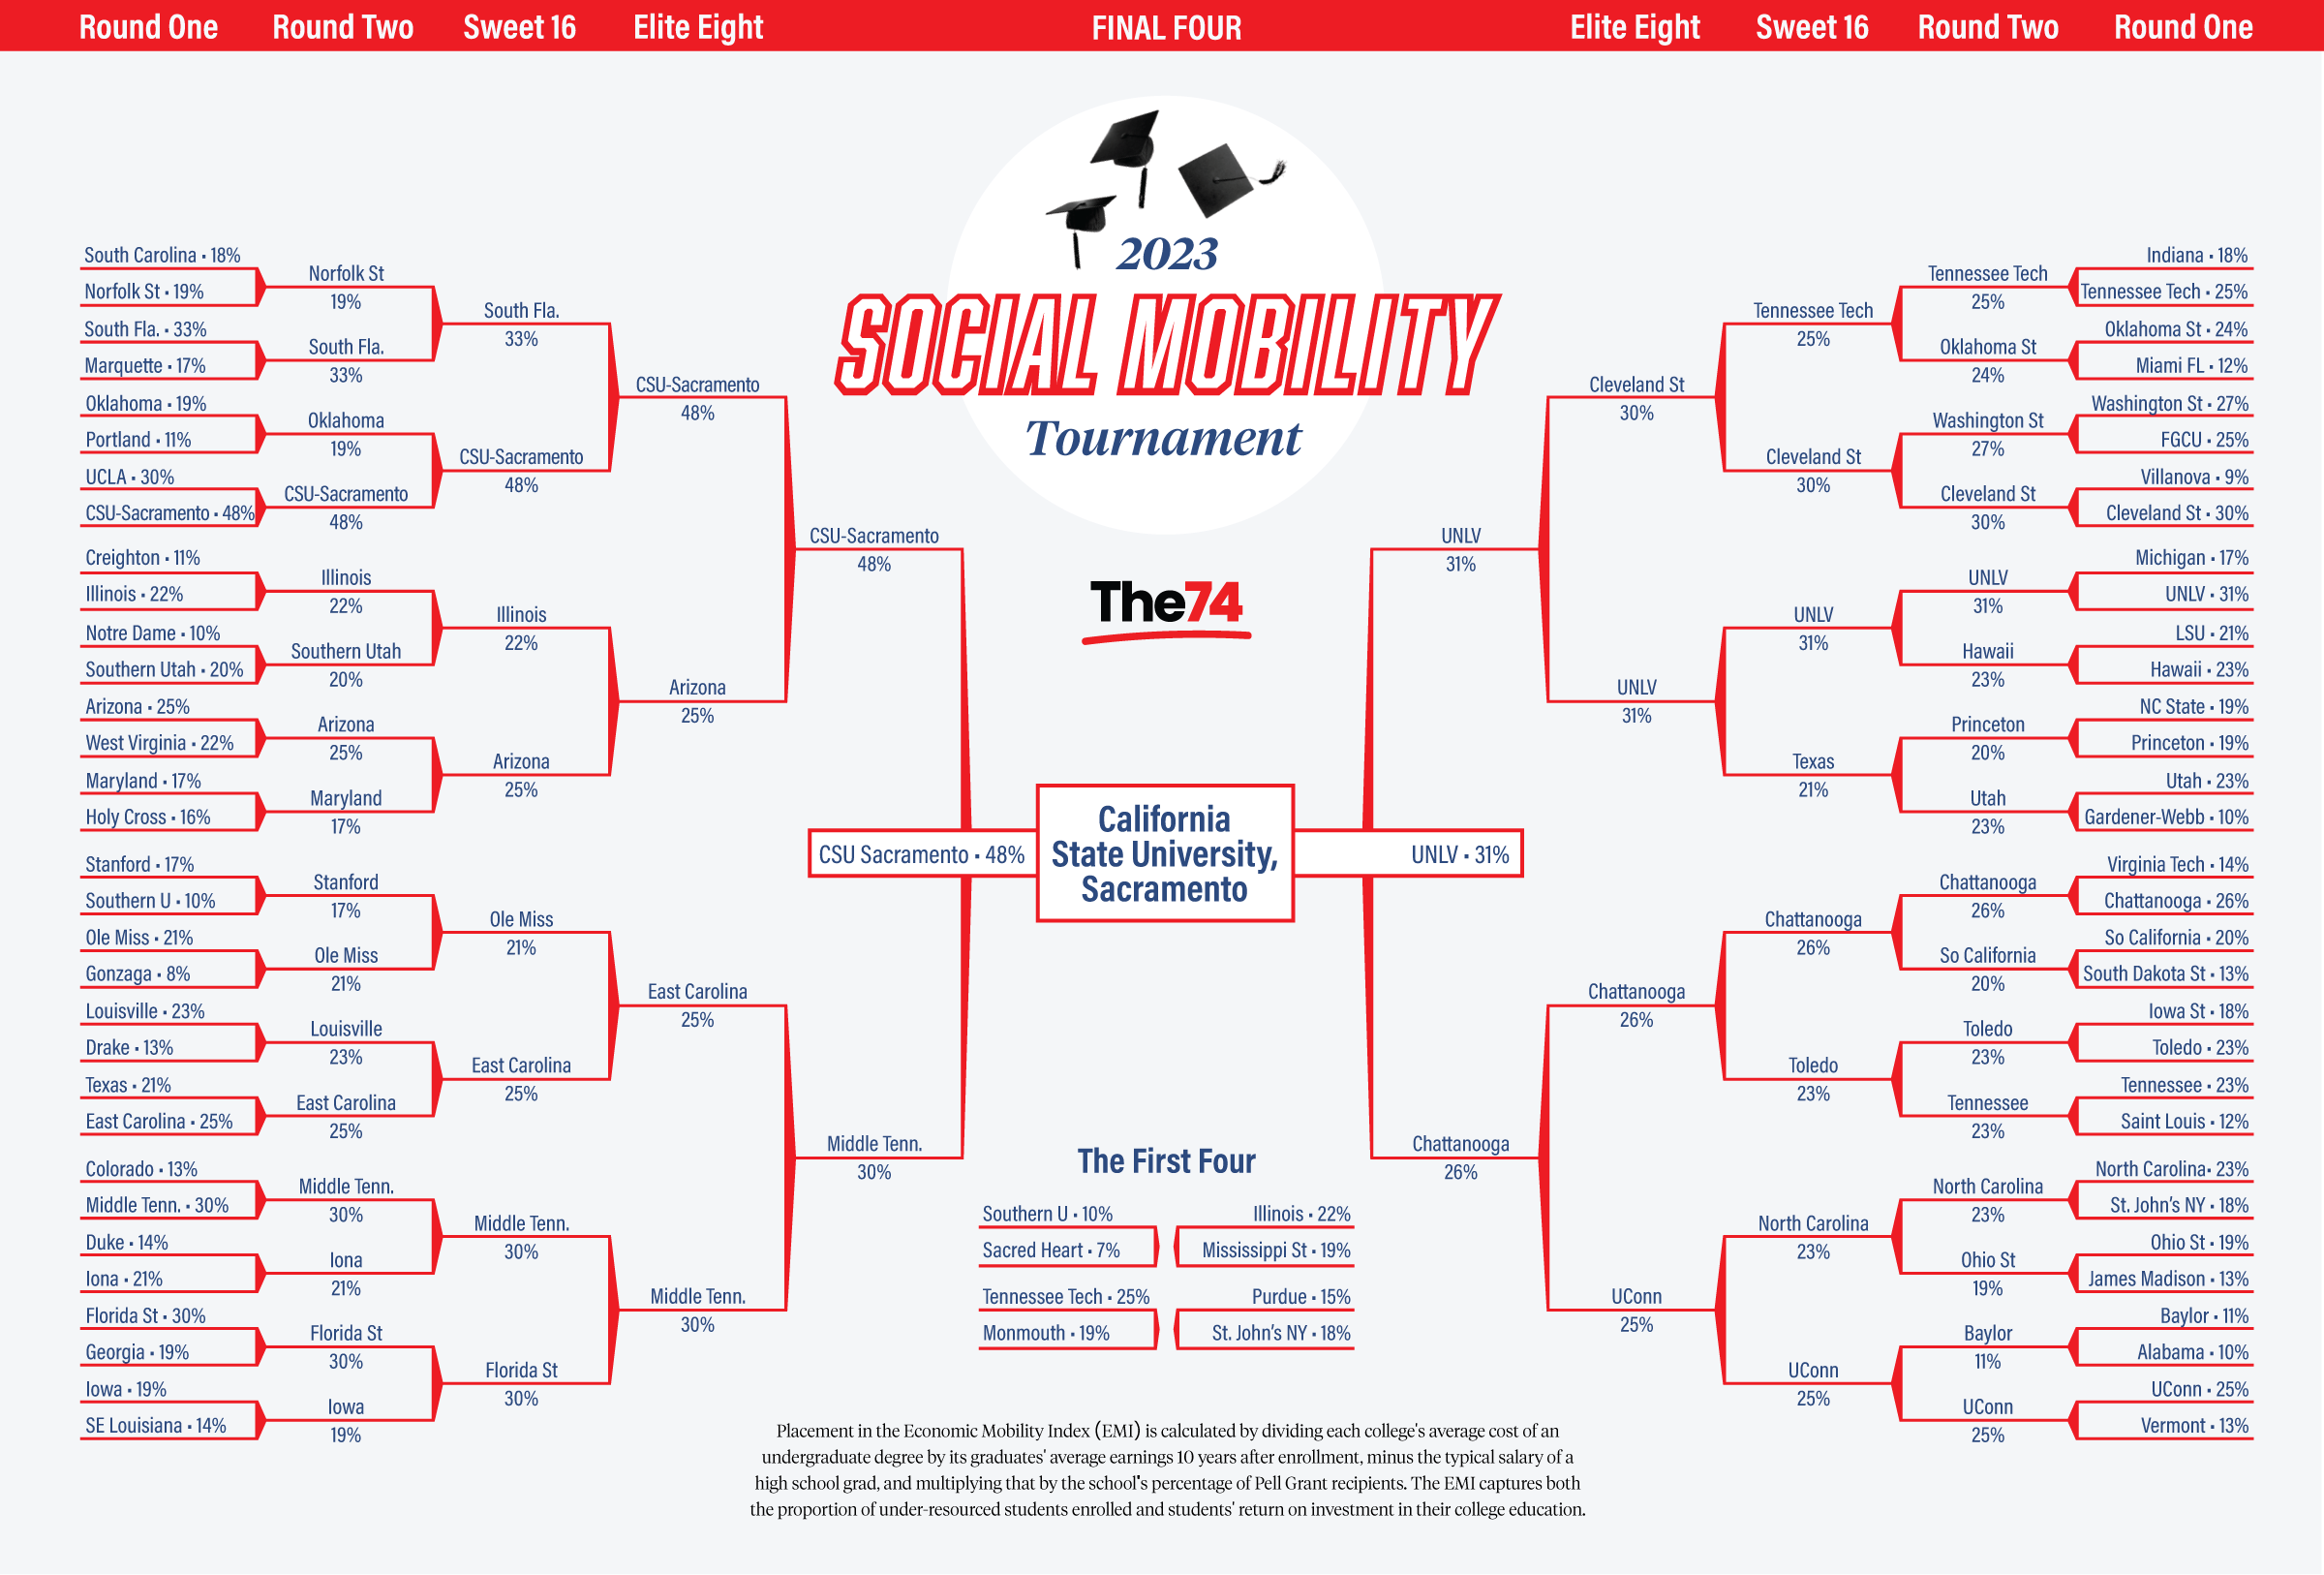
Click to see a larger image of the bracket and where your college stacks up.
This year’s national women’s champion, California State University-Sacramento, appears in the NCAA tournament for the first time. Although the Hornets lost to UCLA in the first round, the players gave it their all, as they did in winning the Big Sky Tournament. Sacramento State, one of only four California teams in the tournament, greatly deserves to be at the top of our Social Mobility Tournament Bracket.
Of the 1,320 schools in the sample, Sac State ranks 19th with an EMI of 48.4%. And it does this while serving a student body with nearly 53% Pell Grant recipients, an amazing 15,200 of whom on average take just 1.2 years to pay down the total net cost of their education. Tom Hanks would surely be proud of his alma mater’s role in providing that measure of upward mobility to so many.
Rounding out our Final Four are the Rebels of UNLV, the Blue Raiders of Middle Tennessee and the Mocs of Chattanooga, all of whom unfortunately lost in the first round of the NCAA tournament. These schools, along with the University of South Florida and UCLA (which, sorry to say, faced Sacramento too early in our bracket) range in rank and EMI from 85th to 192nd and from 33.3% to 26.3%. To get to these figures, these schools enroll large numbers of disadvantaged students who on average can pay back the cost of their degree in 2½ years or less. With such a low opportunity cost, these students can attain family-sustaining earnings early in their working life. In effect, however exciting it is to win games — and exciting it is, indeed — these results are what ultimately matter most for the athletes, as few of them will ever be drafted by the WNBA.
Read more: If March Madness were about social mobility, UC Santa Barbara would be making the Final Four
With college affordability top of mind, it bears digging a bit into the cost of the participating schools. The net price for lower-income students to earn a degree at Sac State is $26,700; at South Florida, it’s $25,000. As a flagship institution, UCLA charges an average of $10,000 more for its degree. For the top 17 teams on the Social Mobility Tournament bracket, the average cost of a degree is $35,800. Of course, these are mostly public universities, the schools most Americans count on to reach living-wage jobs.
As for access, our top 17 colleges manage to serve over 127,000 Pell students. But adding in the next highest-performing 26 colleges in our bracket — those where, on average, the degree can be paid down in less than two years — means a whopping 1,222,600 Pell students are on the road to earning, on average, more than $30,000 per year than someone with only a high school diploma. These 26 additional schools have an average EMI of over 20%, and none have an EMI rank higher than 519th out of the 1,320 colleges in the index.
All in all, with minimal exceptions — such as the scrappy Pioneers of Sacred Heart, who rose past the NCAA’s First Four only to be felled by the Stanford Cardinal, and who, on average, take 5.6 years to pay for their degree — the schools in the tournament make it possible for their lower-income students to pay down the cost of their bachelor’s in less than three years. This is amazing, considering that 4 out of 10 schools in our database average well over 6½ years to do the same, and students at 264 of these schools take on average 14 years or more to earn back their investment in their education.
The school that wins the NCAA tournament trophy has every right to celebrate its prowess on the court. After all, it’s not easy to defeat six teams with winning records while millions watch. But colleges such as those making a run for the Social Mobility Tournament championship are also worthy of celebration for succeeding so well at helping thousands of disadvantaged students climb the earnings ladder leading to the American Dream of economic well-being.
While we can’t wait to see who makes it to the Elite Eight and on to the Final Four, we look forward to the time when colleges that win in our parallel bracket, as Sac State has done, proudly announce on T-shirts, advertising and websites that they are “Income Mobility Champions.”
March Madness is indeed a great escape, but social mobility is the great escape.