A look at the top and bottom LAUSD elementary schools in the CORE accountability index
Craig Clough | April 19, 2016
Your donation will help us produce journalism like this. Please give today.
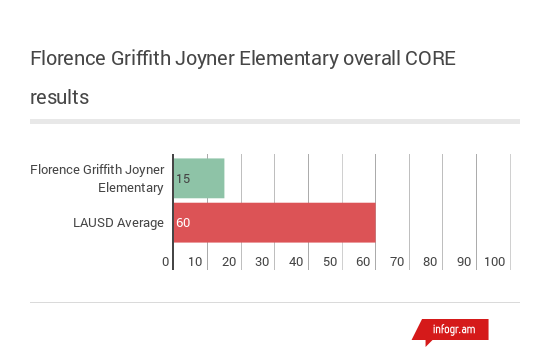
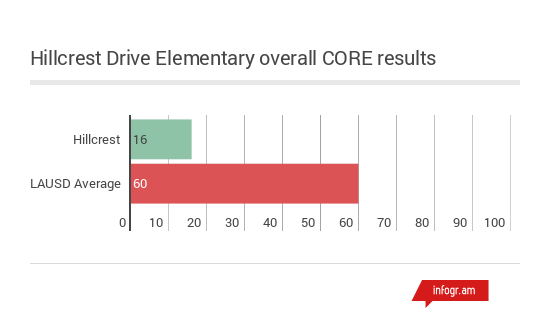
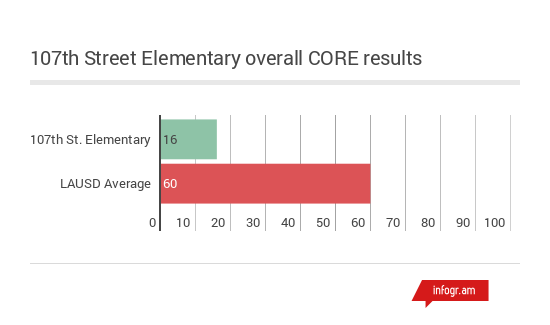
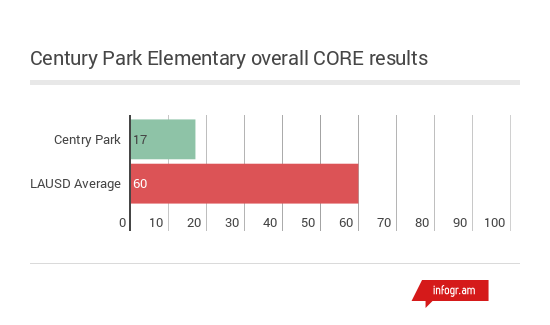
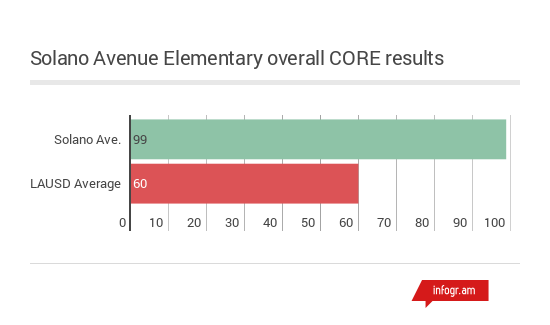
 To help understand the California Office to Reform Education’s (CORE) new school accountability system, LA School Report recently logged and listed all 714 LA Unified schools by their score top to bottom. We also calculated the average of all the schools and discovered the mean score was 60.
Below are breakdowns of LA Unified’s elementary schools with the highest and lowest scores.
The LA Unified schools with the five lowest scores — actually seven schools, as a few tied — are all located in South Los Angeles or San Pedro with students that come primarily from low-income households. Low performance on the Smarter Balanced standardized tests combined with high levels of chronic absenteeism and suspension rates were the most common factors that resulted in the low CORE scores.
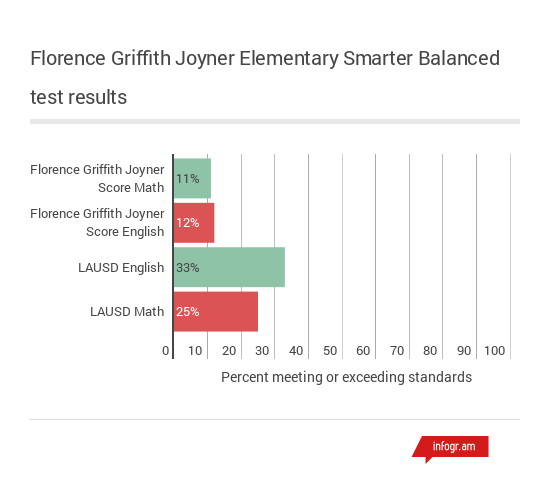
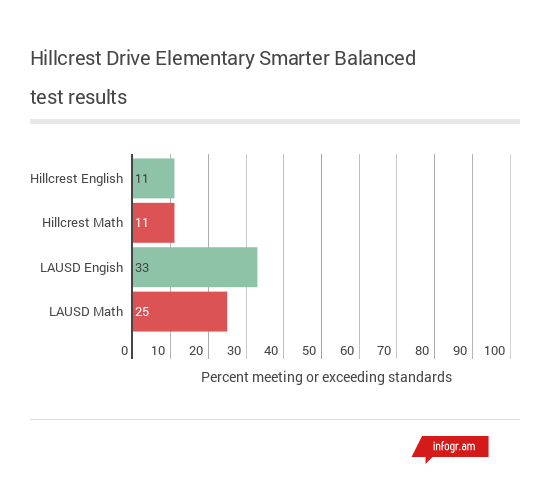
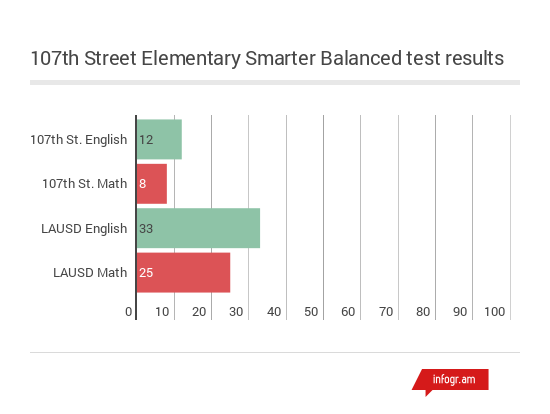
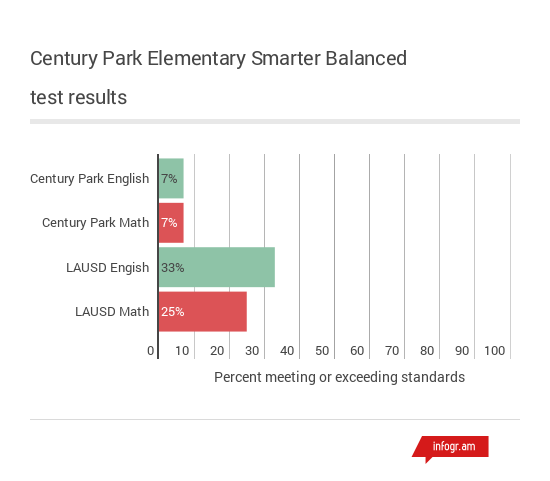
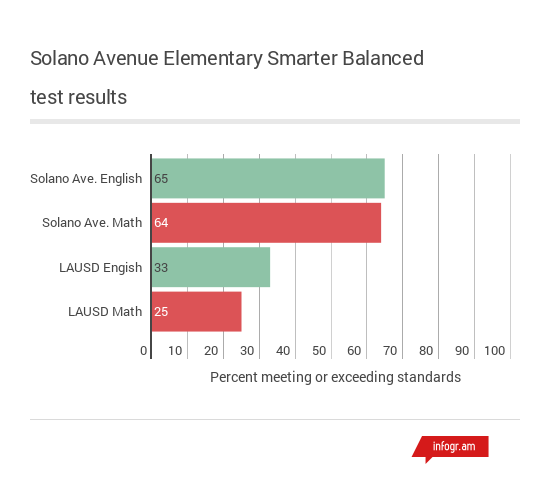
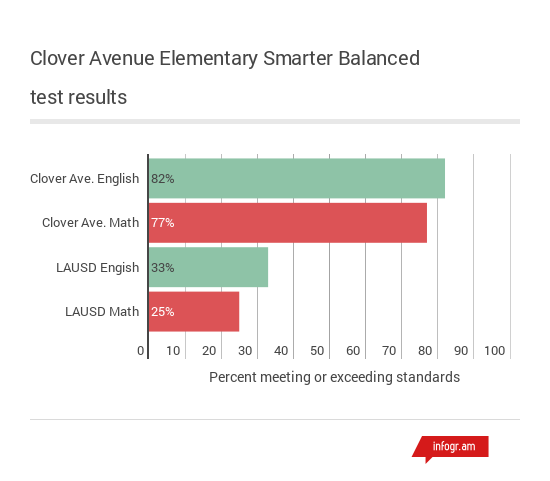
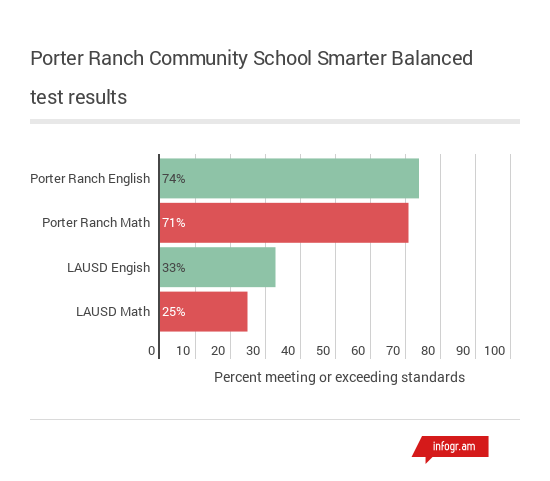
The average number of students in the bottom five who met or exceeded the standards in the English Language Arts portion of the Smarter Balanced tests was 12.42 percent, and average who did so in the math portion was 8.71 percent. This compares to a district average of 33 percent for English and 25 percent for math, while the students at the top five schools averaged 78.66 percent in English and 75.88 in math.
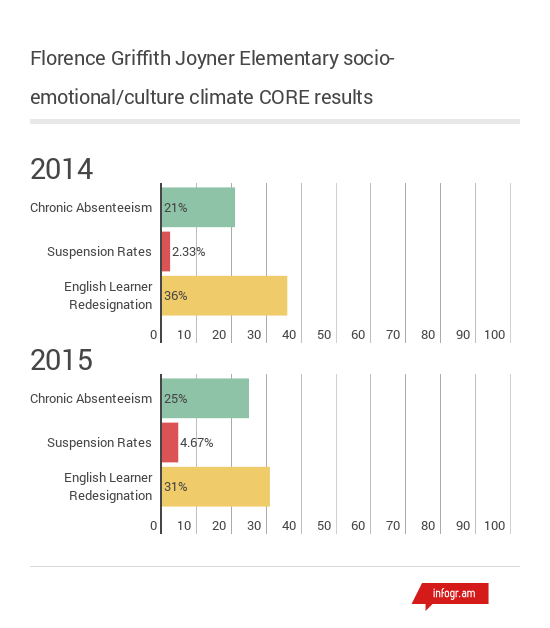
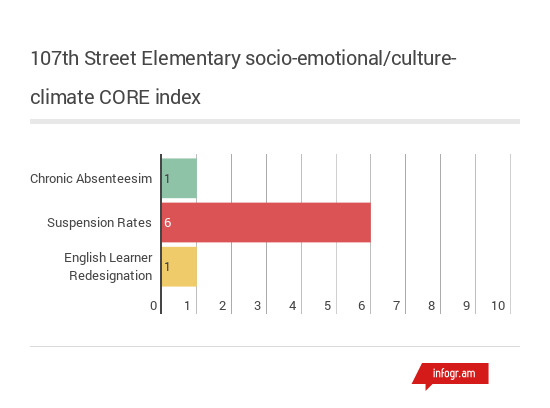
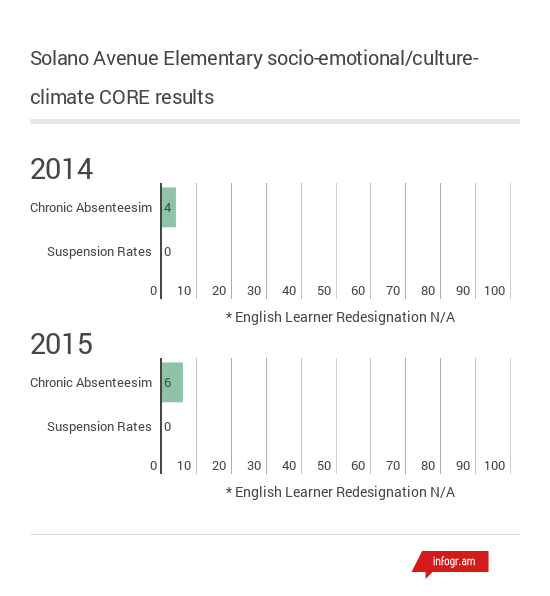
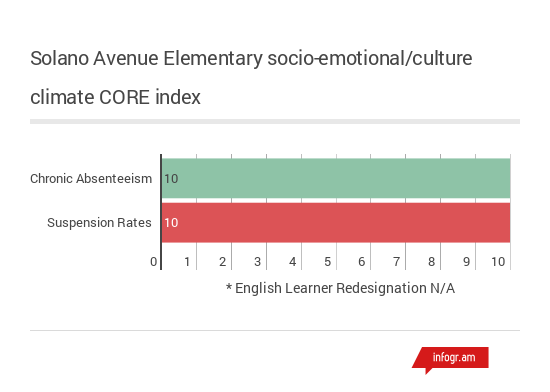
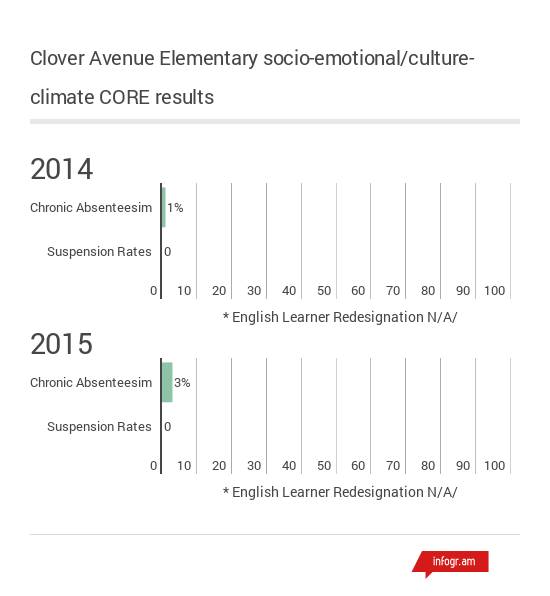
The gulf was also wide in performance on absenteeism and suspension rates, where the lowest schools had an average 18.85 percent chronic absenteeism and 2.12 percent average suspensions, versus a 4.11 percent absenteeism average and 0.03 percent average suspensions for the top schools.
There are also big differences in the demographics of the top and bottom schools, with the bottom schools having an average English learner rate of 29 percent, versus 8.5 percent for the top schools. The bottom schools also had an average of 11.28 percent of students in special education, versus 6.4 percent for the top schools.
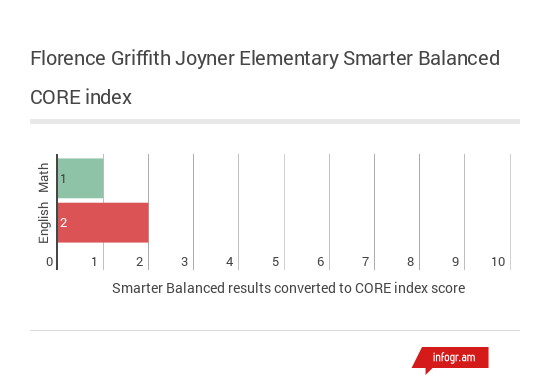
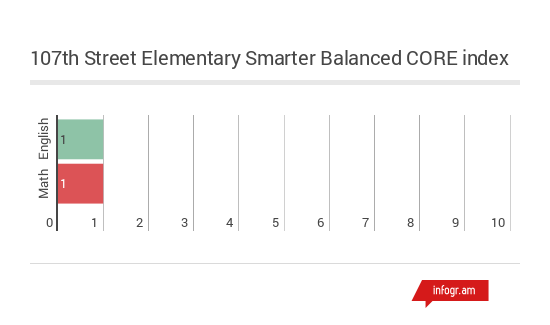
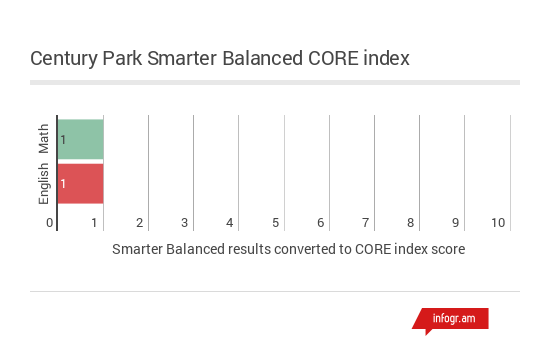
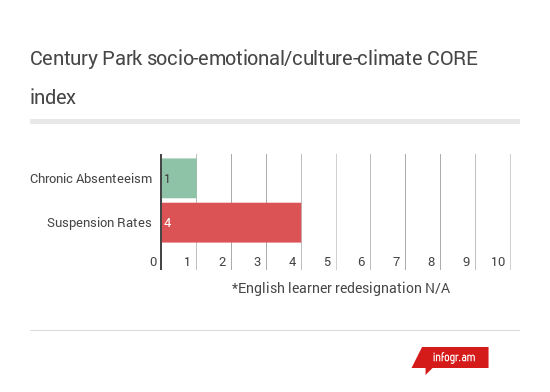
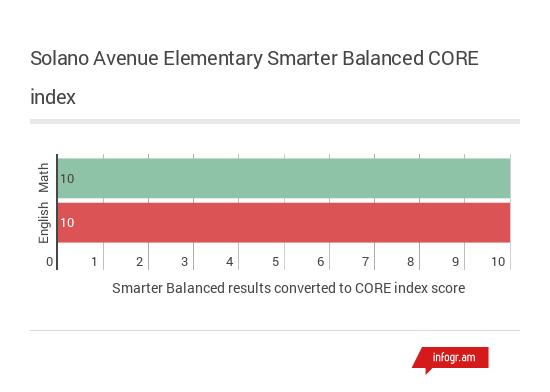
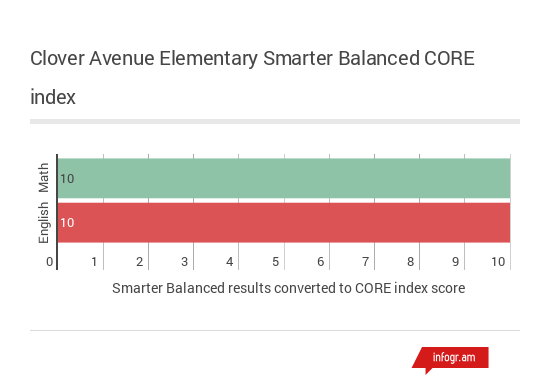
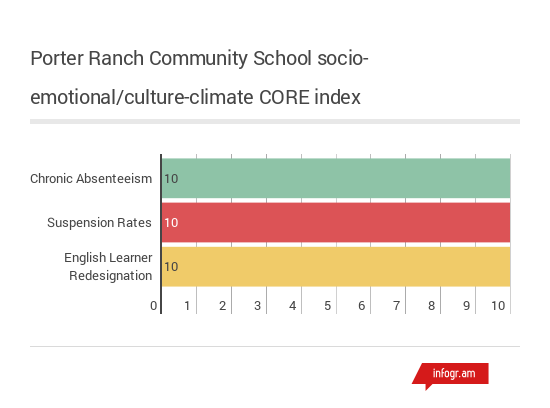
The CORE system is based on 60 percent academics and 40 percent for socio-emotional/culture-climate factors like absenteeism and suspensions. Were CORE numbers to be calculated again next year, the scores would also include factors for academic growth and the results of student surveys. As the data is from one year, growth is not measured.
• Read LA School Report’s analysis of CORE data for LAUSD schools.
• Why the CORE system was developed and why it is only temporary.
• Why charter schools aren’t included in the CORE data.
Two of the bottom five schools — Florence Griffith Joyner Elementary and 107th Street Elementary — are part of the Partnership for Los Angeles Schools, a nonprofit that manages 17 of LA Unified’s historically challenged schools in collaboration with the district, the City of Los Angeles and philanthropic organizations.
Luz Maria Castellanos, senior manager of external relations and communications for the Partnership, pointed out that while some of the organization’s schools struggled with the CORE evaluation, they still experienced significant growth and improvement.
Although Joyner’s Smarter Balanced scores were low, Castellanos said they represented growth compared to the school’s last performance on the California Standards Test, which was discontinued in 2014. Joyner also scored poorly on absenteeism and suspension, but Castellanos said the 2015-16 school year has seen improvements in these areas.
In addition, “Joyner has lots of qualitative evidence of transformation in school culture (feedback from staff and parents, etc.), which we believe will fuel further academic growth in this year’s (Smarter Balanced tests),” Castellatios said in an email. She also said this is the first year 107th Street has joined the Partnership “so this year will be the baseline year for SBAC performance under the Partnership’s direction.”
For a closer look at a few of the schools with the lowest scores, check out the slideshow for each school featuring some of the key data from its CORE score.
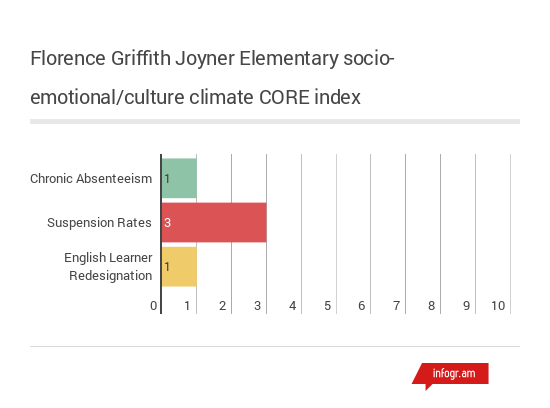
Florence Griffith Joyner Elementary School
1963 East 103rd Street
Los Angeles, 90002
CORE score: 15
CORE rank: 714 out of 714
Demographics
Latino: 67%
African American: 29%
White: 4%
Asian: 0%
English learners: 37%
Students with disabilities: 11%
Free and reduced lunch: 95% (2014-15)
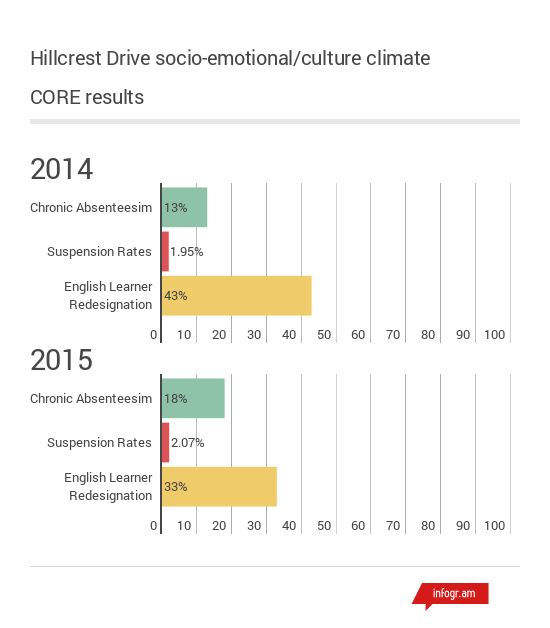
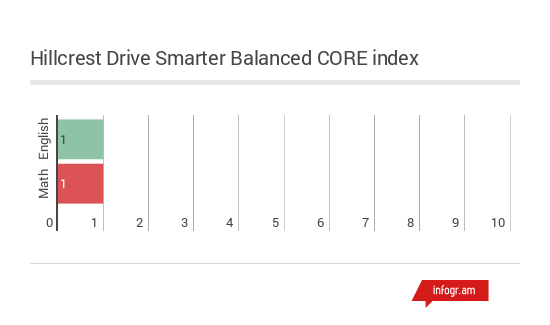
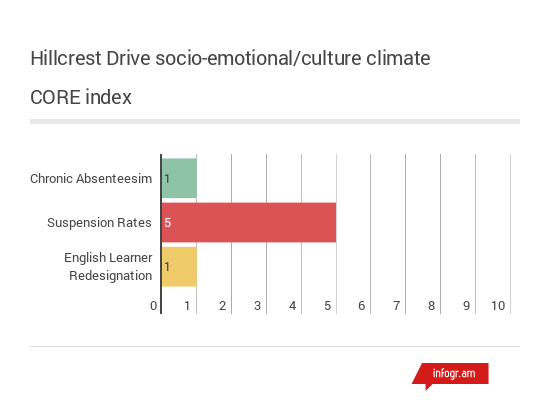
Hillcrest Drive Elementary
4041 Hillcrest Drive
Los Angeles, 90008
CORE score: 16
CORE rank: 713 out of 714
Demographics
Latino: 49%
African American: 46%
White: 2%
Asian: 0%
English learners: 34%
Students with disabilities: 13%
Free and reduced lunch: 81.3% (2014-15)
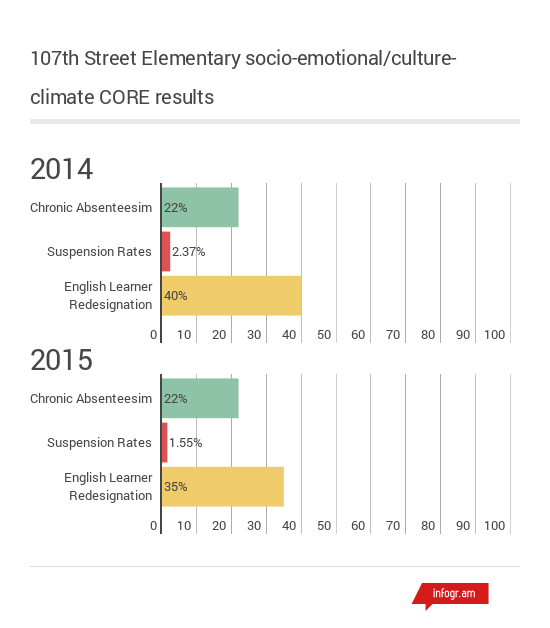
107th Street Elementary
147 East 107th St.
Los Angeles, 90003
CORE score: 16
CORE rank: 713 (tied) out of 714
Demographics
Latino: 73%
African American: 25%
White: 1%
Asian: 0%
English learners: 44%
Students with disabilities: 8%
Free and reduced lunch: 88.5% (2014-15)
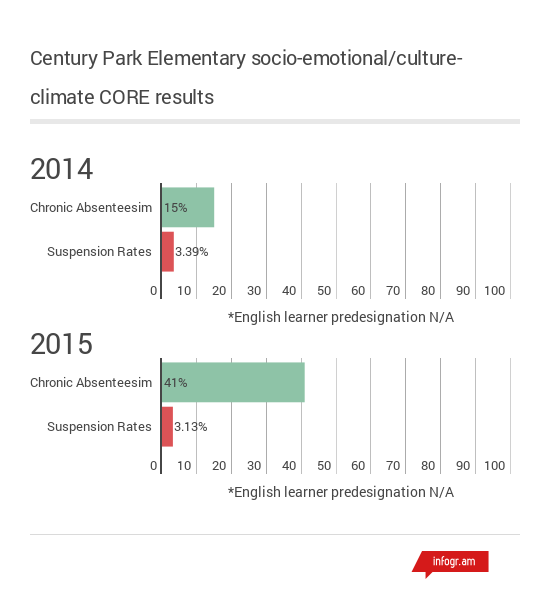
Century Park Elementary
10935 South Spinning Avenue
Inglewood, 90303
CORE score: 17
CORE rank: 712 out of 714
Demographics
Latino: 33%
African American: 65%
White: 1%
Asian: 0%
English learners: 17%
Students with disabilities: 11%
Free and reduced lunch: 83.8% (2014-15)
Three elementary schools tied for the fifth-lowest CORE score, which was 19. The three schools are Annalee Avenue Elementary, Barton Hill Elementary and Cabrillo Avenue Elementary.
TOP PERFORMING ELEMENTARY SCHOOLS
Of the LA Unified elementary schools with with the top five scores on the CORE index — there were nine overall due to some ties — the only perfect score of 100 was Balboa Gifted/High Ability Magnet Elementary, which is a magnet school for gifted students who must already be high-achieving students in order to gain admission.
Of the other schools, which all accept students from the general population, there was much more variety in location than the lowest performing schools. Several are from the San Fernando Valley and several are from the Westside where a much lower portion of students are not living in poverty compared to the district average. None of the top schools are from South LA or San Pedro, where all of the lowest performing schools are.
For a closer look at the top three schools serving the general population, check out the slideshow for each school featuring some of the key data from its CORE score.
Solano Avenue Elementary
615 Solano Avenue
Los Angeles, 90012
CORE score: 99
CORE rank: 2nd (tied) out of 714
Demographics
Latino: 46%
African American: 2%
White: 3%
Asian: 45%
English learners: 18%
Students with disabilities: 7%
Free and reduced lunch: 68.9% (2014-15)
Clover Avenue Elementary
11020 Clover Avenue
Los Angeles, 90034
CORE score: 99
CORE rank: 2nd (tied) out of 714
Demographics
Latino: 16%
African American: 5%
White: 29%
Asian: 43%
English learners: 14%
Students with disabilities: 4%
Free and reduced lunch: 19.94% (2014-15)


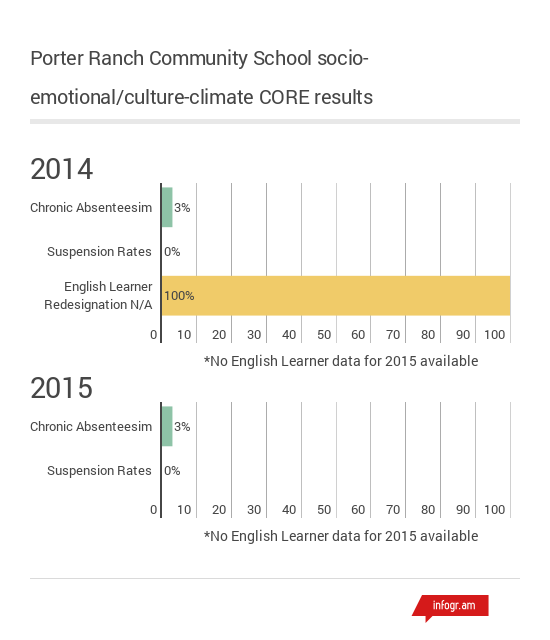
Porter Ranch Community School
12450 Mason Avenue
Porter Ranch, 91326
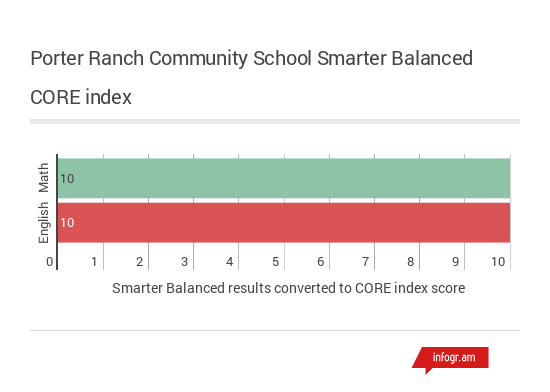
CORE score: 99
CORE rank: 2nd (tied) out of 714
Demographics
Latino: 10%
African American: 4%
White: 34%
Asian: 47%
English learners: 9%
Students with disabilities: 6%
Free and reduced lunch: 10.8% (2014-15)

Six elementary schools tied for the third-highest score, which was 97. They are Woodland Hills Elementary Charter For Enriched Studies, Wonderland Avenue Elementary, Welby Way Elementary Charter, Roscomare Road Elementary, Clifford Street Elementary and Canyon Charter Elementary.
Coming next: the top and bottom middle schools.