Q&A: Seeing the nuances behind the chronic absenteeism crisis
Asher Lehrer-Small | August 8, 2022
Your donation will help us produce journalism like this. Please give today.

Students who miss at least 10% of school days are more likely to face reading difficulties by third grade, less likely to earn a high school diploma and are at higher risk of juvenile delinquency. There’s a word to describe when students surpass this troubling threshold: chronic absenteeism.
It makes intuitive sense. Students who spend less time in the classroom have a harder time keeping up with their peers and may face difficulties developing positive relationships with school staff.
During the pandemic, rates of chronic absenteeism have skyrocketed, hitting 40% in the nation’s two largest school systems, New York City and Los Angeles, and reaching dangerously high levels in many districts in between.
In many cases, difficulties with remote learning, fear of COVID-19 spread in schools, poverty-related barriers such as students being forced to pick up jobs or a mix of those and other factors have added obstacles to students’ school attendance.

But with all eyes on absenteeism as schools nationwide seek to recover from the lasting impacts of the pandemic, Jing Liu, an assistant professor at the University of Maryland, argues that officials should begin by gaining a more complete understanding of the issue.
That starts with expanding what is usually a binary statistic — whether or not a student is absent 10% of days — into a multi-dimensional measure.
In two recent papers, Liu and co-authors find key differences based on when in the school year absences occur and whether they are excused or unexcused. The trends can help schools more quickly identify at-risk students, so they may intervene to support them in getting back on track, he said.
The 74 sat down with the researcher, over Zoom, to glean the key takeaways from his timely work.
This interview has been lightly edited for length and clarity.
The 74: Why do we care about absenteeism? What are the typical differences in outcomes between Student A, with perfect attendance, and Student B, who misses school a few times a month?
Jing Liu: We care about absenteeism for several reasons. First of all, students have to be in school to learn. So for any education policy intervention to work, you have to have students in school.
Second, I have this new paper published with Dr. [Seth] Gershenson that shows there’s this strong impact of absenteeism on student learning in the short run and also for longer-run outcomes including high school graduation and college enrollment. So if we care about those outcomes, we have to reduce absenteeism.
Lastly, absenteeism is also linked to drug abuse, crime, teen pregnancy, a host of undesirable outcomes. So cutting absences can also benefit students in those different aspects.
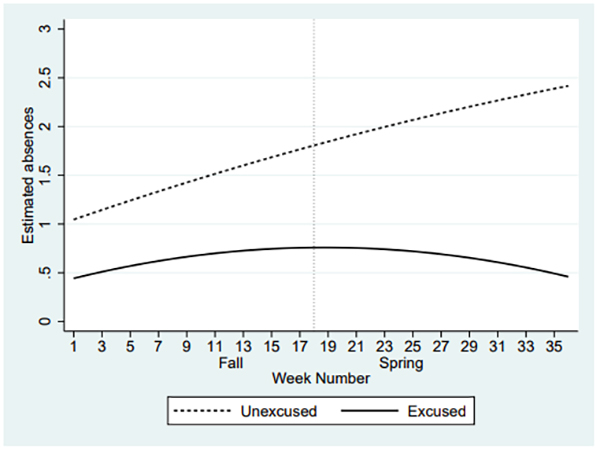
One pattern that you and your co-authors found in the April study that caught my attention is when a student has an unexcused absence early in the year it tends to precipitate increased levels of truancy later on in the year and in future grades. But that trend doesn’t hold for excused absences like a doctor’s appointment. So can you tell me a little more about what you saw there?
Sure. So for this study, we are able to use really nuanced data. We were able to look at the patterns in how absences evolve within a school year and also as students progress over grades.
So what do we see? Unexcused absences grow pretty dramatically within a school year while the excused absences stay relatively stable over time. If we look at just absences in the first month, especially unexcused absences, you can do a pretty good job of predicting their [increased] trajectory in the rest of the school year. For students who are really disengaged in the first month, they are likely to be very disengaged for the entire school year.
Why is that?
There’s some existing research looking at how absences beget absences. For example, if you’re missing a few mathematics classes at the beginning of the year, when you come back, you’ll find it harder to keep track of the content. And that may generate additional absences.
It might also be related to personal relationships. Because if you are absent, now you are not having a strong connection with your teacher, with your classmates. And that might make you more disengaged, not wanting to come to class even more in the future.
My research team is planning to do some surveys of students to understand more about their experience.
What sort of interventions should educators be thinking about to remedy those issues?
A first place to look is how to intervene early instead of waiting until the end of the school year. By just relying on the first month of absenteeism data and students’ reasons for absences, we can get a pretty good sense about who’s going to be the most disengaged. Although all loss of instructional time is bad, what we show is, really, those unexcused absences in middle and high school are driving the growth of absences. By looking out early, district leaders and school principals can decide with whom to intervene. Timing really matters.
Secondly, it’s very telling that growth of absences was linked to perception of school climate. We would want to intervene in terms of improving someone’s perception of school climate, so it’s either a sense of belonging or support of their learning. Starting there, I think we might be able to prevent the accelerating growth of absences down the road.
For school districts that want to operationalize some of this, is there a magic formula they could use instead of the typical 10% threshold that gives issues like absence type and timing their proper weight?
First of all, I think chronic absenteeism is still a useful metric. Under the Every Student Succeeds Act, more and more states are using that as an indicator for school quality. Before we didn’t really actually have an indicator on absenteeism. So I don’t want to just critique [the approach].
However, we can do better than just using a binary measure [of whether absences are above or below 10% of all school days]. A lot of places are now collecting this detailed level data that includes the timing and also the type of absences. But they’re not systematically putting the data together and using it in useful ways.
We are actually working with a middle school team in [an undisclosed district] to use those absenteeism data to create our own on-track/off-track indicator and see whether we can flag kids for a risk of disengagement very early in the school year. And then by intervening in a dynamic and targeted manner, we’ll see if we can change kids’ trajectory.
In hard and fast terms for a school leader who is collecting these data, when would you say is the right time to check in with the numbers and see which kids are at risk? Is it October 1, October 15? Halloween?
I think one month after the school year starts, that’s what we did with our research.
Although to actually address the question, we not only need a timing, we also need a threshold. So how many kids are going to be put in the bucket to intervene? We need a little bit more work to look at how setting different thresholds can change the results and how predictive those early absences are for other outcomes we care about. This is one of the first studies doing this kind of thing and we need a bit more research to provide more actionable suggestions.
In words that folks who aren’t statisticians can understand, can you say a little bit more about how you and your team crunched the numbers to get these results?
Basically, we just look at the growth of absences over time. So we basically put all the absences into weekly measures. So for example, for Jing, for me, if I’m absent for two classes in the first week, three classes in the second week, then we can see this growth by using a model and the number we get is just the slope. So we use this metric to indicate the level of engagement [in school].
Any last points? What topics haven’t we covered yet?
One detail is that as we look more deeply into the reasons for absences, we know that the excused/unexcused division is not perfect. Sometimes maybe an unexcused absence is just that the parent forgot to contact the school. And sometimes it’s really an unexcused absence, but the student is able to make up a reason.
I remember when I turned 18 as a high school senior, that was when I could call myself out of school. So then I had a lot of “excused” absences.
Exactly. So from a practical perspective, given that the volume of excused absence is pretty minimal, I think if we are going to design interventions for use in practice, I probably would suggest school districts to not differentiate between absence types, because it creates an additional data collection burden and it probably won’t impact results that much.
This article was published in partnership with The 74. Sign up for The 74’s newsletter here.